![]()
|
|
|
Liberalization within a national framework involves a large variety of legislative issues. Capital account liberalization, interest rates set by the market, and flexible exchange regimes create the framework for the globalization of financial transactions. Foreign investments (both foreign direct investment - FDI - and portfolio investment) flow in and out in almost all countries. Interest rate liberalization is proceeding rapidly, and flexible exchange rates have become dominant in developing countries as well. (For a summary of economic changes and the problems and opportunities of financial liberalization, see International Monetary Fund (IMF), Capital Account Liberalization (http://www.imf.org) and Finance&Development, Interest Rates - An Approach to Liberalization, and IMF Survey November 17, 1997 on Currency Crises)
| When capital is free to move, it has to make a choice where to settle
down. Liberalization of national legislation is performed in order to encourage the
presence of multinational business. Industries previously closed to FDI have been opened,
state property has been privatized, procedures (such as administrative approvals and
customs procedures) have been simplified, and incentives and concessions have been
introduced. Since the mid-1980s, and in the context of rapid changes in the global economy and broader market-oriented reforms, most countries in all regions that until then had maintained widespread restrictions and controls on FDI undertook substantial revisions in their investment regimes, with a view towards incorporating FDI more fully into their economic development and growth strategies. They engaged in an unprecedented process of liberalization of previous FDI impediments and adopted a host of positive measures aimed at attracting FDI. These trends continued in 1998. |
 |
| More specifically, of the total of 145 regulatory changes
relating to FDI made during 1998 by 60 countries, 94% were in the
direction of creating more favourable conditions for FDI, and 6% in the
direction of greater control. During the period 1991-1998 as a
whole, 94% of the FDI regulatory changes were in the direction of creating
a more favourable environment for FDI, in both developed and developing
countries.
The majority of liberalization measures in 1998 related to operational conditions. In contrast with previous years, fewer new industries were opened up, and these related mainly to telecommunications, retail and wholesale trading. In terms of regional distribution, it is workth noting that the Asian financial crisis triggered significant efforts to attract FDI by the countries in the region, both in terms of the number of measures (51) and the number of countries (16) involved. (UNCTAD, World Investment Report 1999) |
 |
Privatization and special economic zones are major contributors to globalization. The privatization of state-owned assets has opened up enormous investment opportunities for multinational corporations. Although large-scale privatization has been occurring in developed countries since the early 1980s, there remains much state property to be privatized. This is especially true of the energy and telecommunications industries, which are the two largest sources of privatization revenues. In 1996, privatization revenues increased to $88 billion, from $69 billion in 1995. While industrialized countries still account for the majority of global privatization revenues, the share of FDI in privatization revenues is much larger in developing countries. In many developing countries, everything that has been privatized has been purchased by foreigners.
Numerous
special economic zones and special regional packages were introduced in the years leading
up to 1999, both in developed and developing countries. Unfortunately, there are no
up-to-date global or regional quantitative data on special economic zones, the
characteristics of which vary greatly. Some are dedicated to the preferential treatment of
exports only (export processing zones, or EPZs). Others are for preferential treatment of
both exports and imports (free trade zones, or FTZs), while a third category is for
preferential treatment of imports only (foreign access zones, or FAZs). (See
the ILO's Special Action Programme on Social and Labour
Issues
in e
Privatization represents a reversal of the process of nationalization begun early in this century. In most communist countries, a wave of nationalizations ensued shortly after communist governments assumed power in the aftermath of World War I and World War II. In Western Europe, the nationalization process stretched over several decades, but essentially took hold in the 1930s. At the time, European governments of divergent political views were largely in agreement over the benefits of a strong state role in their domestic economies. (Energy Information Administration (EIA), Privatization and the Globalization of Energy Markets)
In part, the roots of privatization stem from the recent decline of socialism as well as from the growing conviction that free enterprise advances the wealth of nations better than nationalized industries and planned economies. Privatization has also been driven by the increasing globalization of the world economy. Several decades of rapid growth in international trade and investment have made competitiveness in international trade an essential factor in the ability to create jobs, raise real wages, and generate wealth.
Although privatization efforts differ substantially from country to country, there is a strong common economic rationale underlying the various decisions to privatize state resources. In general, the privatization of state-owned industries has been performed to achieve one or more of several objectives. These include: (1) raising revenue for the state; (2) raising investment capital for the industry or company being privatized; (3) reducing the role of government in the economy; (4) promoting wider share ownership; (5) increasing efficiency; (6) introducing greater competition; and (7) exposing firms to market discipline. For many countries, privatization has become the only effective method of raising investment capital on favourable terms. High levels of past public-sector borrowing have saddled many countries with large levels of debt. As a result, these countries have had little recourse but to sell state assets to reduce their debt, generate revenue, and raise investment capital. (EIA, Privatization and the Globalization of Energy Markets)
National governments have pursued various methods of privatization - the motivations for which are as various as the methods themselves. (Note: The following section is taken from the EIA report Privatization and the Globalization of Energy Markets.)
In some instances, countries have chosen to transfer ownership of industries or companies swiftly and completely. Argentina, the United Kingdom, Chile, and New Zealand have generally undertaken some of the most ambitious privatization efforts by auctioning off companies directly to the public - thereby letting the market determine the value of these companies through the bidding process. In some cases, (for example, the privatization of British Energy) the auctioning off of a company revealed an enormous divergence between the newly-discovered market value and the previous book value of the company as recognized by the government.
Most privatizations have been gradual. For example, in the case of British Petroleum, partial government ownership dates back to 1914. In 1977, the government reduced its ownership share from 66% to 51%, and then to 46% in 1979, 31% in 1983, under 2% in 1987, and finally to zero in 1995. In addition, governments have often sold shares of a state-owned firm while retaining a portion of the company (a "golden share"), thereby maintaining a limited degree of control over the company. This practice has become widespread, both in OECD and non-OECD countries.
Often governments have chosen to sell state-owned utilities directly to companies - either foreign or domestic. For example, when Bolivia privatized the state electricity monopoly Ende, it was broken into three electricity generation companies and directly sold off to foreign (primarily US) utility companies.
Another form of privatization involves deregulation. Deregulation has been the most prevalent form of energy privatization in the United States, most recently in natural gas transportation and electric power generation and transportation. Electric power generation, transmission, and distribution has long been held up as an example of a "natural monopoly". However, as the notion of the natural monopoly has evolved, so has the justification for maintaining government-controlled utilities.
The removal of a subsidy can also be viewed as a form of privatization. The removal of subsidies for European coal operations, for example, precipitated the constriction of Europe's coal mining industry and encouraged a large shift in coal investment from European mines to mines in the United States, Australia, and Latin America.
Another aspect of privatization concerns the methods by which public ownership is achieved. In many formerly communist countries, voucher schemes have been adopted whereby ownership in an industry is simply transferred to the general public with no cash exchanged. A lack of developed equity markets may have encouraged voucher schemes. After the initial distribution of vouchers, individuals may buy or sell them, thereby encouraging the creation of stock exchanges. In some instances, the transfer of ownership has been implemented with labour and management being allotted favoured shares.
Country and Regional Developments
| For the first time since 1994, global privatization activity recorded a sharp decline in 1998. Proceeds dropped by 26% to around $114billion, from an all time high of $154 billion in 1997. As in previous years the bulk of privatization revenues were generated in OECD countries, around 75% of global privatization revenues. Most of the activity took place among the European members of OECD. Privatization activity in non-OECD countries, still robust in 1997, was drastically reduced as the financial crisis in Asia and Russia reduced cross border investments and shook investor confidence. (OECD (Organisation for Economic Co-operation and Development), Privatization trends, Financial Market Trends, No 72, February 1999 http://www.oecd.org) | 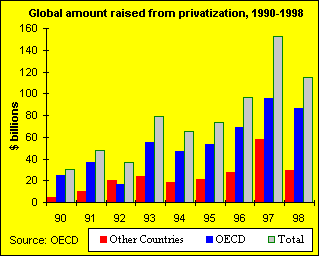 |
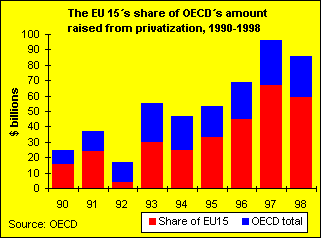
| Notwithstanding the decline in OECD countries' privatization
activity in 1998, they increased their share of global
activity from about 62% in 1997 to 75%. The decline in privatization was
slightly more pronounced for members of the European Union (EU), where
proceeds fell by about 12%. These countries accounted for more than half
of global proceeds and over two thirds of OECD activity. Since 1992, the
EU share of global proceeds has been growing quite steadily against
the background of EU directives aimed at leberalisng markets, particularly
in electricity and telecommunications sectors. In 1998, Italy
(15.8%), France (15.7%) and Spain (13.5%) alone accounted for close to
half of OECD countries' privatization proceeds. (See table on country breakdown of global amount raised from privatization) |
 |
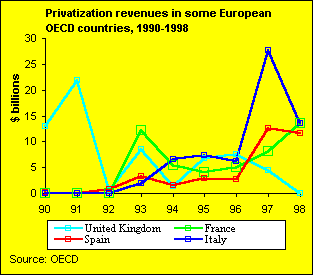 Among industrialized countries, the
United Kingdom was the leading country in privatization in until mid 1990s . Prior to 1979, the UK possessed
one of the largest public enterprise sectors in Europe. Since then, successive
Conservative governments undertook an extensive privatization programme. Between
1979 and 1995, over £50 billion in state assets (excluding proceeds from the sale of
government-owned housing) were sold to the private sector, and the share of
employment accounted for by publicly-owned industries fell from 7.2% to under 2%. (The British Council, The Evolution and Performance of UK
Privatization)
The Italian privatization programme, one of the largest in recent years, continued at a slower pace in 1998. The proceeds were $14 billion, which is almost half of the previous year's level. The offering of the fourth tranche of the oil and gas company ENI, the first tranche of which had been sold in 1995, reduced government stake to 35% and raised around $7 billion, while the successful public offer of BNL in the banking sector raised $4.6 billion.
In France, privatization activities picked up in 1998, thanks to the $7 billion second public offering of France Telecom shares in December, which was also the largest European public offering in 1998. In addition, Deutsche Telecom acquired a 2% stake in France Telecom as part of the planned strategic alliance between the two companies. This sale of 66.3 million shares, reduced the government stake from 75% to 62%
Spain has one of the most ambitious privatization programs in Europe; over the last two years more than $24 billion have been raised from the sale of government-owned assets including telecoms, financial services and electricity. In 1998 total proceeds dropped slightly to $12 billion from sales that included the secondary offering of Argentaria Bank, Endesa and Tabacalera. (OECD, Privatization trends, Financial Market Trends, No 72, February 1999.)
Country breakdown of global amount raised from privatization ($ million)
| 1990 | 1991 | 1992 | 1993 | 1994 | 1995 | 1996 | 1997 | 1998p | |
| Australia | 19 | 1,042 | 1,893 | 2,057 | 1,841 | 8,089 | 9,052 | 16,815 | 7,146 |
| Austria | 32 | 48 | 49 | 142 | 700 | 1,035 | 1,251 | 2,020 | 2,935 |
| Belgium | - | - | - | 956 | 549 | 2,681 | 1,222 | 1,562 | 1,467 |
| Canada | 1,504 | 808 | 1,249 | 755 | 490 | 3,998 | 1,770 | - | 11 |
| Czech Republic | 1,077 | 1,205 | 994 | 442 | 469 | ||||
| Denmark | 644 | 122 | 222 | 10 | 366 | 45 | 4,502 | ||
| Finland | - | - | - | 229 | 1,166 | 363 | 911 | 835 | 1,999 |
| France | - | - | - | 12,160 | 5,479 | 4,136 | 5,099 | 8,189 | 13,467 |
| Germany | - | 325 | - | 435 | 240 | - | 13,228 | 1,125 | 364 |
| Greece | 35 | 73 | 44 | 558 | 1,395 | 3,892 | |||
| Hungary | 38 | 470 | 720 | 1,842 | 1,017 | 3,813 | 1,157 | 1,966 | 353 |
| Iceland | 21 | 10 | 2 | 6 | - | 4 | 129 | ||
| Ireland | - | 515 | 70 | 274 | - | 157 | 293 | - | - |
| Italy | - | - | - | 1,943 | 6,493 | 7,434 | 6,265 | 27,719 | 13,619 |
| Japan | - | - | - | 15,919 | 13,773 | - | 6,379 | 4,009 | 6,641 |
| Korea | - | - | - | 817 | 2,435 | 480 | 1,866 | 539 | 600 |
| Luxembourg | - | - | - | - | - | - | - | - | - |
| Mexico | 3,122 | 10,754 | 6,859 | 2,503 | 766 | 167 | 73 | 2,690 | 995 |
| Netherlands | 716 | 179 | 17 | 780 | 3,766 | 3,993 | 1,239 | 831 | 335 |
| New Zealand | 3895 | 17 | 967 | 630 | 29 | 264 | 1,839 | - | 441 |
| Norway | - | - | - | 287 | 118 | 521 | 660 | 35 | 28 |
| Portugal | 1,092 | 1,198 | 2,326 | 500 | 1,132 | 2,425 | 3,011 | 4,968 | 4,271 |
| Poland | 23 | 23 | 238 | 245 | 385 | 714 | 749 | 2,179 | 2,020 |
| Spain | 172 | - | 820 | 3,223 | 1,458 | 2,941 | 2,679 | 12,522 | 11,618 |
| Sweden | - | - | 378 | 252 | 2,313 | 852 | 785 | 1,055 | 172 |
| Switzerland | - | - | - | - | - | - | - | - | 4,426 |
| Turkey | 486 | 244 | 423 | 546 | 412 | 515 | 292 | 466 | 1,009 |
| United Kingdom | 12,906 | 21,825 | 604 | 8,523 | 1,341 | 6,691 | 7,610 | 4,544 | - |
| United States | - | - | - | - | - | - | - | - | 3,100 |
- Nil or insignificant
p: provisional
Source: OECD
| Privatization in OECD countries has predominantly been made through public offerings of equity in the capital markets. In fact, during the period under consideration, public offerings were the most important privatization method in every year except 1992. The choice of public offerings is not surprising, as the two main requirements for using this method - a reasonably deep national capital market and relatively little need for restructuring - are normally met in OECD countries. The other main method of privatization is a trade sale to strategic investors wishing to exercise managerial control. This method has been much less common in the OECD area. (OECD, Financial Market Trends, No. 72, February 1999.) | 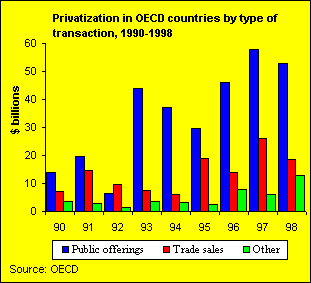 |
| Retail investors continued to be the most importat purchasers at public offerings in the OECD area. Their role, however, has been declining steadily beginning in 1996, from 73% of proceeds to around 58% in 1997 and 47% in 1998. | 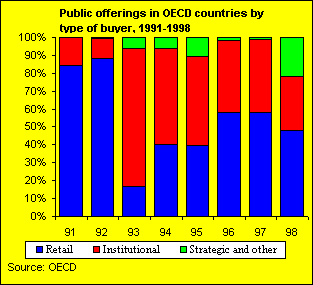 |
| Since 1991, the share of privatization-related public offerings bought by non-residents has declined steadily, while that of residents has increased. Even though international investors continue to play an important role, this would seem to suggest that privatizations are having some success in promoting domestic equity investments, even in countries where such investments traditionally have been relatively limited. Domestic equity markets are developing rapidly in many OECD countries, becoming deeper and more liquid. At the same time, institutional investors in many OECD countries, where bond markets have traditionally played the main role, are slowly becoming more interested in equities. | 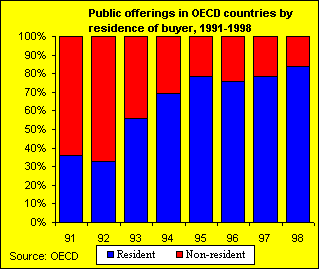 |
| For trade sales, the trend seems to be the opposite. In 1998, resident firms were purchasers of 54% of trade sales in OECD countries, down from 68% the previous year. This decline is largely consistent with the trend in the previous decade. This might point to a greater liberalisation of cross border investment in the OED area - especially in industries where foreign buyears were previously unwelcome. It is consistent with an overall strenghtening of foreign direct investment flows in the OECD area during the last 9 years. (OECD, Financial Market Trends, No. 72, February 1999.) | 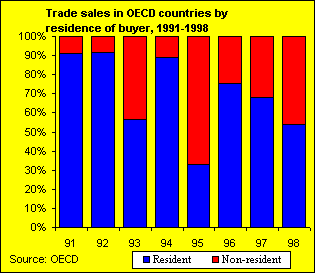 |
| Between 1988 and 1997,
developing-country governments earned more than $224 billion from the sale of state-owned
assets. In 1997, privatization proceeds in developing countries totaled $66.6
billion, compared with $25.4 billion in 1996, mainly from the sale of
large infrastructure projects. (World Bank, Global Development
Finance 1999, http://www.worldbank.org)
|
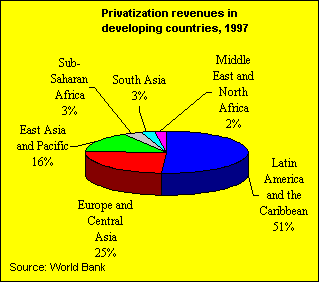 |
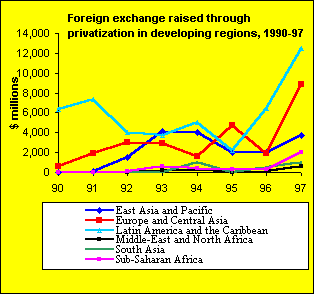
| Latin America accounted for 51% of developing countries' privatization revenues in 1997, with Brazil leading the privatization activity. Privatization in Europe and Central Asia regained momentum in 1997, as a result of important sell-off programs in Russia, Kazakhstan, Poland and Hungary. Despite a decline in privatization activity in some East Asian countries, owing to the 1997 economic downturn, the region recorded a significant increase in revenues compared with 1996, largely because of public offerings of Chinese state-owned enterprises. The Middle East and North Africa privatization revenues increased slightly owning to Moroccan and Egyptian sales. South Asian privatization activity grew in 1997, led by India. Sub-Saharan Africa divestitures increased considerably from 1996, led by sales in South Africa, Côte d'Ivoire and Senegal. (World Bank, Global Development Finance 1999) | 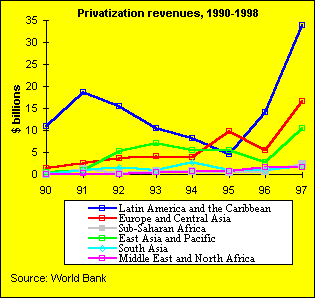 |
| With the exception of Indonesia and Thailand, privatization activity in East Asia and Pacific grew significantly during 1997. China contributed to 90% of pricatisation revenues in the region, raising more than $9.1 billion. The sale of a 25% stake in China Telecom Hong Kong through American depository receipts (ADRs) raised more than $3.9 billion and equity sale in the expressway, airlines, and power sector generated more than $1.1 billion, $989 million, and $710 million, respectively. (World Bank, Global Development Finance 1999) | 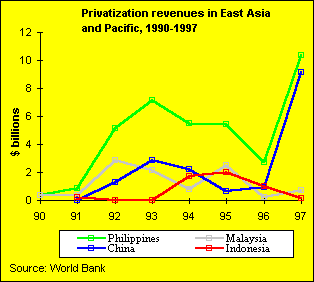 |
| Brazilian sales dominated privatization activity in Latin
America and the Caribbean in 1997 with revenues growing sharply from $5.8
billion in 1996 to $18.7 billion in 1997. The private sale of a 42%
voting interest in the Brazilian mining company and transport giant,
Companhia Vale do Rio Doce to a consortium led by Companhia Siderurgica
Nacional amounted to $3.3 billion and consituted the largest privatization
up to 1997 in Latin America.
The surge in privatization activity in Brazil has been fueled partly by the acceleration in states' sales in 1997, as state governments have been encouraged to sell assets in order to restructure their debt. (World Bank, Global Development Finance 1999) |
 |
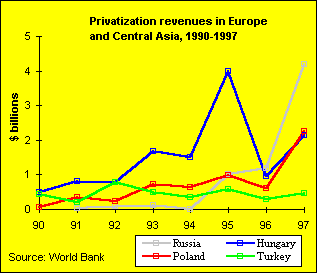
| Privatization proceeds in Russia grew significantly in
1997, raising an estimated $4.2 billion in 1997, compared to $1.2
billion in 1996. More than half of total revenues were generated from
selling off oil- and gas-related enterprises, including the private
sales of Eastern Oil Company (VNK) and Tyumen Oil Company, which raised
$875 million and $820 million, respectively.
Poland's privatization program showed remarkable progress in 1997, after recording mixed results over the transition period. The country raised more than $2.2 billion in 1997, compared to $605 million in 1996. The sale of large entities such as Bank Handlowy, KGHM Copper and Powszechny Bank Kredtowy Bank helped push up revenues in 1997, raising more than $1.0 billion. Hungary's privatization proceeds picked up in 1997, raising $2.1 billion following a decline in 1996. The public offerings of three major enterprises generated more than 76% of the countri's total revenues for 1997. (World Bank, Global Development Finance 1999) |
 |
| The government of the Arab Republic of Egypt has
accelerated its privatization program since 1996, and proceeds reached $2
billion in 1996-97 versus $773 million in 1993-95. Profitable public
enterprises were sold off by aggressively tapping international equity
markets (listing of Global Depository Receipts (GDRs) on the London
Stock Exchange), floating shares on the Cairo Stock Exchange, and making
some sales to strategic investors.
Marocco's privatization prgram, launched in 1993, has promoted much activity on the Casablanca Stock Exchange despite bureaucratic hurdles that slowed down the program. Moroccan privatization prceeds amounted to more than $2 billion during the 1993-97 period. (World Bank, Global Development Finance 1999) |
 |
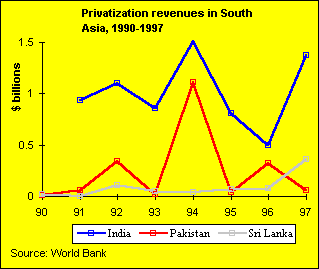
| Total privatization revenues in India were estimated
at $1.4 billion in 1997, because of a successful sell-off program
of large enterprises in the telecom and banking sectors. The public
offer of global depository receipts (GDRs) in two telecommunication
companies, Mahanagar Telephone Nigam Limited and Videsh Sanchar Nigam
Limited, raised $806 million in 1997. Privatization proceeds from
the banking sector amounted to $555 million in 1997.
Pakistan's privatization program, which saw many deals canceled or delayed, further slowed down during 1997, raising only $58 million compared to $317 million in 1996. (World Bank, Global Development Finance 1999) |
 |
| A number of countries in Sub-Saharan Africa are rapidly
privatising a large portion of the most attractive state-owned
enterprises, thereby attracting significant inward portofolio and direct
investment and contribution to the development of the region's stock
markets.
Total proceeds from privatization in Sub-Saharan Africa are estimated at $2.3 billion in 1997, largely due to a successful see-off prgram in South Africa. Sales in the telecommunications sector raised more than $1.7 billion - or 72% of total regional privatization proceeds in Sub-Saharan Africa. The South African government raised $1.3 billion by selling a 30% stake in Telkom to foreign investors. It also sold Radio Jacaranda for $15 million. (World Bank, Global Development Finance 1999) See also World Bank, Privatization in Africa and Private Sector Expansion in Central Europe |
 |
Relation of privatization revenues to FDI
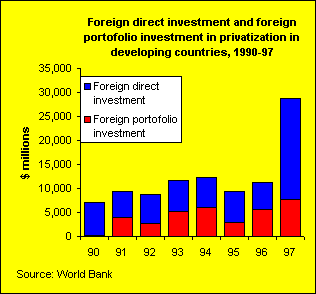
| Foreign investors (portofolio and
direct investors)
contributed to 43% of total privatization proceeds in the developing
world, generating an estimated $28.8 billion in foreign exchange in
1997. Foreign Direct investment accounted for 73% of the total.
In 1996, foreign direct investment and portofolio investment contributed to 50% of total privatization proceeds. In 1996, privatization proceeds in developing countries totaled $25.4, compared with $66.6 billion in 1997. In 1988-1995, foreign investors accounted for about 43% of total privatization proceeds. Of this, FDI accounted for four-fifths of foreign investment generated from privatization, with the remainder coming from portfolio investment. (World Bank, Global Development Finance 1999) |
 |
| The extent of foreign participation in privatization has
varied accross regions, ranging from 37% in Latin America and the
Caribbean to 84% in Sub-Saharan Africa. (World Bank, Global
Development Finance 1999)
Countries with the largest privatization revenues differ greatly from each other with regard to the share of FDI in privatization revenues. In Hungary, for example, foreigners have purchased almost all privatized assets. (For country-specific information, see table on privatization revenues, number of privatizations and FDI from privatization) |
 |
Privatization has involved almost all industries and sectors. In the United Kingdom, public housing has been privatized, and in the United States many municipal services have been privatized, such as waste disposal.
The sectoral distribution of privatization varies quite significantly from year to year, and sectors that were important in a given year may all but disappear the following year. The overall sectoral distribution in any particular year depends most critically on which countries dominate in privatization transactions, and where in their privatization programme these countries stand.
| Generally, governments have first sold companies that needed the least
restructuring and that were already operating in competitive sectors - most notably
manufacturing companies and financial institutions. Privatization operations in
manufacturing surged in 1993 in OECD countries, because that was when many OECD countries
embarked on large-scale privatization programmes. On the other hand, the privatization
programme of the UK had already been running for over a decade, and consequently at the
beginning of the 1990s it was in a completely different phase than the privatization
programmes in other OECD countries.
For non-OECD countries, privatization in manufacturing has been more important than for OECD countries. To some extent, this reflects the fact that state ownership in manufacturing industries was much more widespread in these countries than in the OECD. On the other hand, privatization of financial institutions are much less predominant in non-OECD countries than in the OECD area. With the exception of 1993, the amount raised from the privatization of financial institutions has been fairly modest in non-OECD countries. (OECD, Financial Market Trends, No. 72, February 1999.) |
 |
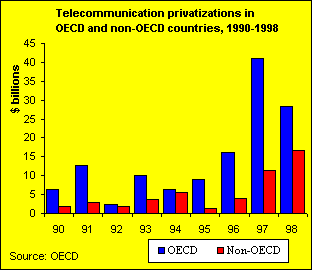
| The most visible similarity of sectoral distribution of privatization
proceeds among OED and non-OECD countries is the continuing
predominance of the telecom sector in 1998. In terms of value, telecom
sales generated around $45 billion. This represents a drop of 14% compared
to 1997, but nonetheless telecom privatizations accounted for about 40% of
activity.
Telecom privatizations within OECD countries dropped to $29 billion from the peak of $41 billion in 1997, but they continued to be the predominant are of activity, accounting for about a third of proceeds. The most important transactions in 1998 included the public offering of France Telecom, Swisscom and Sonera. In non-OECD countries, the predominance of telecom privatizations was even more pronounced. In fact, telecoms was the only sector where privatization activity did not decline. Proceeds increased by more than 50% over 1997 levels and accounted for 60% of total revenues in these countries. (OECD, Financial Market Trends, No. 72, February 1999.) |
 |
| The second most important sector in the OECD area was financial services, where the value of proceeds rose to just over $20, or about a quarter of OECD privatization proceeds in 1998, from around $6 billion a year earlier. This is the only sector in OECD in which privatization proceeds increased significantly. In 1998, BNL in Italy, CIC in France and the fourtn tranche of Argentaria in Spain, are amongst the most important bank privatizations. Outside OECD, however, where this sector's importance was previously on the rise, activity declined. (OECD, Financial Market Trends, No. 72, February 1999.) | 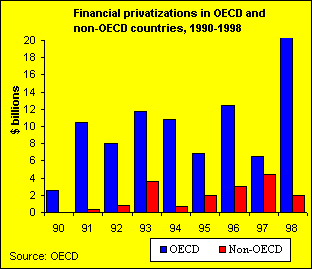 |
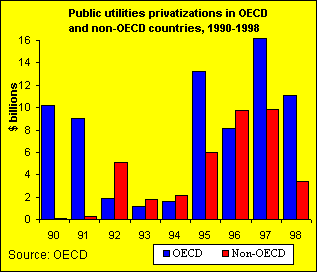
| In the area of public utilities (including energy), privatization
transactions declined in 1998. This was particularly the
case in the non-OECD area where a rising trend since the early 90s was
quite sharply reversed. (OECD, Financial
Market Trends, No. 72, February 1999.)
See also World Bank, The private infrastructure industry - company approaches and World Bank, The private infrastructure industry - a global market of US$60 billion a year |
 |
Energy companies that have been privatized include some of world's largest petroleum companies, based in the industrialized nations. Global giants, such as British Petroleum, British Gas, Elf Aquitaine (France), ENI (Italy), Petro Canada, Repsol (Spain), and TOTAL (France) have all recently undergone transitions from state ownership to at least a significant degree of private ownership. Other large petroleum companies lie in the countries of the former Soviet Union and in Latin America, and have also been moving towards private ownership.
See petroleum privatization in UK, France, Italy, Canada, Spain, Norway, Argentina, Mexico, Venezuela, Brazil, Colombia, Ecuador, Peru, Bolivia, Trinidad, Russia, Albania, Bulgaria, Czech Republic, Slovakia, Hungary, Poland, Romania, China and Vietnam.
Electric power is expected to be the world's fastest-growing source of end-user energy supply over the next two decades. To meet global power projections, it is estimated that over $1 trillion will have to be spent over the next ten years. The electric power industry has undergone a substantial degree of privatization in a number of countries in recent years. Growth in power generation is expected to be particularly high in Asia, with China leading the way.
The privatization of electric utilities continues in both developing and developed countries. Although varying extensively in degree and method, countries as different as India and the United States have exposed their electric power generation industries to greater market forces. Chile led the way with electric utility privatization in the late 1980s, followed by the United Kingdom. Currently, most Latin American countries are privatizing their electric power industries to some extent. Prominent electric power privatization efforts also are currently underway in Australia, Canada, China, Scandinavia, India, Indonesia, Morocco, Pakistan, the Philippines, and Eastern Europe.
See privatization of electric utilities in UK, Finland, Norway and Sweden, France, Italy and Portugal, Hungary, Poland, Russia and the Czech Republic, Australia, India, Pakistan, China, New Zealand, Indonesia, the Philippines and Marocco, Argentina, Bolivia, Chile, Colombia and Peru, Brazil, Mexico and Venezuela, the Dominican Republic and Trinidad.
Privatization has also resulted in the growing convergence of petroleum- and electric power-related activities. This growing interconnection between petroleum companies (particularly those with substantial natural gas production or distribution activities) and electric power generation results from a number of factors. In certain regions, natural gas is becoming the fuel of choice for new electricity generation projects - in part, because of the relative environmental advantage that natural gas has over coal or oil. The much-improved efficiency of gas-fired electricity generation units in recent years has also improved the relative competitiveness of natural gas as a fuel for the generation of electricity. Furthermore, in several countries natural gas deregulation has accompanied the deregulation of electric power. In the aftermath of several prominent deregulatory efforts in the US natural gas market - culminating in the final deregulatory push of the Federal Energy Regulatory Commission (FERC) in 1993 through FERC Omnibus Order 636 - US natural gas pipeline companies have become particularly well-suited to enter newly opened markets in a variety of international regions undergoing a deregulatory and transitional phase. (EIA, Privatization and Globalization of Energy Markets.)
On 15 February 1997, the WTO successfully concluded nearly three years of extended negotiations on market access for basic telecommunications services (See summary on negotiations and agreement). The markets of the participants accounted for over 91% of global telecommunications revenues in 1995. The timetable for opening markets in early 1998 parallels an earlier agreement by the countries of the European Union to create a single market for telecommunications services.
The WTO one-page Protocol and the annexed schedules and Most Favoured Nations exemption lists entered into force on 5 February 1998. Some participants who had not accepted the protocol had until 31 July 1998 to do so. The schedules on basic telecommunication services are an integral part of the GATS schedules of services commitments in force since the Uruguay Round. In a number of schedules, a member's commitments for particular services are to be "phased in". In these cases, while the schedule will formally enter into force on the date of the Protocol as a whole, the actual implementation date for the commitments will be on the date specified in the schedule. (See World Trade Organization (WTO) data on telecommunications markets)
Telecommunications privatization has concentrated in the Asia-Pacific and Western Europe. The share of FDI in privatizations has grown in recent years (See the Economist, Telecommunications Survey) In addition, FDI patterns in telecommunications are changing. The linguistic factor and the obvious legacy of colonization may still be significant in specific cases, such as Telefonica de Espana or Portugal Telecom, which favour foreign investment in South America or in Lusophone countries. However, former colonial ties are no longer the most important factor influencing foreign investment. Indeed, the former colonies are themselves becoming major foreign investors: Singapore Telecom has invested $2.2 billion in 21 countries, including a cable telephony operator in the United Kingdom, of which it was a former crown colony. (See ITU tables on privatized companies, 1984-1996: privatizations raising less than US$ 1 billion, privatizations raising between US$ 1 billion and US$ 2 billion, privatizations raising between US$ 2 billion and US$ 5 billion, privatizations raising over US$ 5 billion.Free trade zones (FTZs) and export processing zones (EPZs) are sites where foreign or domestic merchandise may enter without a formal customs entry or the payment of customs duties or government excise taxes. EPZs are dedicated to manufacturing for export, whereas FTZs also handle imports. If the final product is exported, no customs duty or excise tax is levied. This applies to both free trade and export processing zones. If the final product is imported into the host country, state, or region, it may receive preferential treatment, depending on the FTZ. In addition to FTZs and EPZs, there are also foreign access zones (FAZs), which are dedicated to encouraging imports, not exports. Host countries, states, and regions offer a variety of incentives, including preferential custom duties, taxation and financing.
The ILO defines EPZs as
The ICFTU defines the export processing zone as follows: "a clearly demarcated industrial zone, which constitutes a free trade enclave outside a country's normal customs and trading system where foreign enterprises produce principally for export and benefit from certain tax and financial incentives." (International Confederation of Free Trade Unions (IFCTU), Behind the Wire: Anti-union repression in the export processing zones)
There are various ways to ensure that there is no misuse of the advantages of these zones. An enclave or fenced zone is monitored by an around-the-clock customs presence. Fenced zones are typical of Latin America and the Caribbean. Non-fenced zones, which allow the enterprises to bypass the normal customs and duty-free import procedures, rely primarily on the firms' self-declaration of input inflows and output outflows. This self-declaration system is used, for example, in Mauritius. Special bonded manufacturing warehouses (BMWs) rely on spot checks of factory inventories by customs officials. Transparent criteria for each inventory check are based on pre-tabulated input-output (physical) coefficients (such as the fabric-garment conversion factor). This method is used, for example, in Bangladesh. (See, World Bank, Free Trade Status for Exporters)
FTZs and FAZs
There are no global figures available on the number or location of FTZs or FAZs.
As of June 1997, the United States had 225 foreign-trade zones and 359 subzones in 49 states. These zones employed 300,000 people. If the final product is exported from the United States, no US customs duty or excise tax is levied. If, however, the final product is imported into the United States, customs duty and excise taxes are due only at the time of transfer from the foreign-trade zone and formal entry into the US. The duty paid is the lower of that applicable to the product itself or its component parts. Thus, zones provide their users with opportunities to save on customs duties. In addition, zone procedures provide one of the most flexible methods of handling domestic and imported merchandise. (The National Association of Foreign-Trade Zones, http://imex.com/naftz.html)
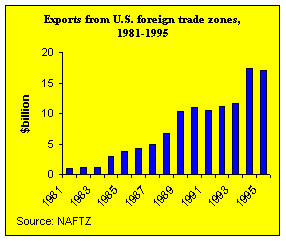 Exports from US foreign trade zones have
increased dramatically since the early 1980s. Exports from facilities operating under FTZ
procedures amounted to $16.9 billion. While this is a slight decline over the previous
year's $17.4 billion, it does not appear to represent a significant deviation from the
long-term upward trend of FTZ exports. A 1994 report showed a 50% increase in exports
(from $11.6 to $17.4 billion), which was well above the average annual increase of the
past two decades. (See the tables in the Annual
Report of the Foreign Trade Zones Board)
As already noted, FAZs are for imports only. In Japan, outward FDI and exports outweigh inward FDI and imports. The government of Japan, operating under the "Law on Extraordinary Measures for the Promotion of Imports and Facilitation of Foreign Direct Investment", enacted in 1992, has established a network of Foreign Access Zones (FAZs) around the country, particularly in regional markets, to attract increased imports and foreign investment. A total of 22 FAZs were operating as of June 1997. Each FAZ concentrates import facilities and related businesses around an international airport or harbour, resulting in a dynamic regional centre for foreign business. Host regions offer a variety of incentives, including preferential taxation, low-interest financing and more, to encourage foreign businesses to locate in their FAZs and resident firms to expand their imports.
EPZs
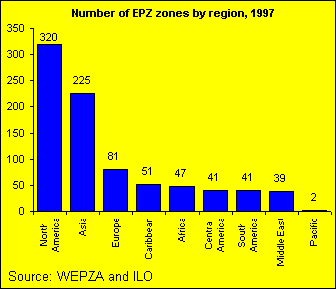 The WEPZA's (World Export Processing Zone Association) Directory for 1997 includes over
800 export processing zones (EPZs). (http://www.wepza.org/~sth/)
According to the ICFTU, "in 1995 there were more than 230 export processing zones, spread across nearly 70 countries, including more than 100 in Latin America and the Caribbean, 64 in Asia and 31 in Africa". ICFTU includes free trade zones to export processing zones, but WEPZA does not.(ICFTU, Behind the Wire: Anti-union repression in the export processing zonesehind the Wire: Anti-union repression in the export processing zones)
Philippine Ecozones
According to the ILO Working Paper Export Processing Zones in the Philippines (1996), there were four zones in 1994. The value of their exports was nearly $2 billion in 1994. There were 310 registered firms in 1994, and 86,265 employees in April 1995.
Since that Working Paper was published, the situation has changed considerably. According to the Philippine Economic Zone Authority (PEZA), Export Processing Zones are one category of ecozone. There are 19 ecozones, which are divided into a number of categories. Industrial Estates (IEs) are tracts of land developed for industrial use. They have basic infrastructure such as roads, water and sewage systems, pre-built factory buildings, and residential housing for the use of the community. Export Processing Zones (EPZs) are special IEs whose locator companies are mainly export-oriented. EPZ incentives include tax- and duty-free importation of capital equipment, raw materials and spare parts. There are five export processing zones: the Baguio City EPZ, Bataan EPZ, Cavite EPZ, Mactan EPZ, and Mactan EPZ II. There are about 250 registered companies in the EPZs, most of which are involved in the manufacture and export of electronics, garments, rubber products, fabricated metals, plastics, electrical machinery, transport equipment and industrial chemicals. Free Trade Zones are areas near ports of entry, such as seaports and airports. Imported goods may be unloaded, repacked, sorted and manipulated without being subjected to import duties. However, if these goods are moved into a non-free trade zone, they are subject to customs duties. Tourist & Recreational Centres contain establishments that cater to both local and foreign visitors to the ecozones. Such businesses include hotels, resorts, apartments and sports facilities. (See, PEZA's introduction to Ecozones)
Mexican maquiladoras
According to Migration News, over 3,000 Mexican maquiladoras employed 743,000 workers at the end of 1995, providing about one in five Mexican manufacturing jobs. The value of the finished products exported from Mexican maquiladoras was over $30 billion in 1995, or 34% of the total value of Mexican exports, second only to oil. In 1994, the US made a net $3.3 billion in new investment in Mexico, including $2.4 billion in manufacturing. About 40% of new 1994 manufacturing investment was in vehicles. (Migration News, Mexican Maquiladoras)
A maquiladora is a Mexican assembly or manufacturing operation that can be subject to up to 100% non-Mexican ownership and management. As long as the imported components brought into Mexico are destined for export, no Mexican import duty is levied on the temporarily imported maquiladora inputs. In lieu of duties, maquiladora operators must post a bond with the Mexican Customs Service to guarantee that components and raw materials are re-exported from Mexico within a six-month period. The maquiladora may bring in as many foreign employees as necessary with the exception of hourly laborers. All hourly employees must be Mexican. Foreign employees must obtain work visas, which usually require a 3-5 day waiting period.
A maquiladora utilizes competitively priced Mexican labour in assembly, processing or other manufacturing operations. It temporarily imports most components parts from the US and other sources. Mexican law also allows these operations to bring in most capital equipment and machinery from abroad. Maquiladora operations are generally labour-intensive cost centres, with most production geared for export from Mexico. Finally, most maquiladoras are located along the Mexican border to the US.
EPZs in Mauritius
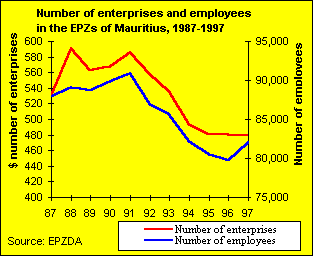 As of December 1997,
480 EPZ companies employed some 82,000 persons in Mauritius (a 2.9% increase from
1996
levels).
The number of enterprises and employees rose steeply until the 1990s. In 1991, the number of enterprises started to decline, and a year later also the number of employees.
The labour productivity and value added per employee have increased steadily over the last ten years. (See the Overview of the Export Processing Zones Development Authority)
Mauritius is still an African success story, but the World Bank suggests that productivity is no longer increasing fast enough to keep pace with wages that have been rising as a result of near-full employment, thus eroding the country's competitiveness. Over a span of some 25 years, real growth averaged 6% annually, resulting in nearly a fourfold increase in real per capita income and the elimination of unemployment. Growth was export-led, fuelled by relatively cheap labour and preferential access to markets in Europe and the US for the country's principal exports, sugar and garments. Notwithstanding this success, there are growing challenges to competitiveness and the sustainability of growth. New competitors have emerged in traditional Mauritian labour-intensive exports, and returns on investment in the EPZs declined steadily in the late 1980s and early 1990s. (See, the World Bank analysis: Mauritius: Sustaining the Competitive Edge)
|
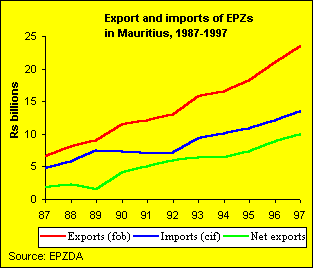
The value of EPZ exports reached Rs 23.5 billion in 1997. The EPZ import bill for 1995 was Rs 13.5 billion. France, followed by the US, the UK, Germany and Italy continue are the main markets for Mauritian EPZ products. (See, the Overview of the Export Processing Zones Development Authority) See also the ILO Report on Labour and social issues relating to export processing zones |
 |
Outward processing is the practice of sending abroad materials, components and supplies for processing or assembly, to have them returned with duty charged only on the value added abroad. According to the WEPZA, outward processing was a US $113 billion import business in the US and the European Union in 1995, of which transport equipment manufacture represented $50 billion, electrical and electronics $34 billion, and garments and footwear $14 billion.
A survey conducted by JETRO (the Japan External Trade Organization) points out that outward processing is increasing. Products made offshore by Japanese affiliates and imported into Japan continue to expand.
The major findings of the JETRO survey are as follows:
According to the Hong Kong General Chamber of Commerce, 54% of
Hong Kong's total exports to the mainland of China (the Mainland) were for
outward processing in the second quarter of 1999, . The proportion was 76%
for domestic exports and 51% for re-exports. On the other hand, 81% of Hong
Kong's imports from the Mainland were related to outward processing. Over
the same period, 86% of Hong Kong's re-exports of Mainland origin to other
places were produced through outward processing in the Mainland.
The corresponding proportions for exports to the Mainland in the second quarter
of 1998 were 49% for total exports, 79% for domestic exports and 44% for
re-exports; whilst proportions for imports from the Mainland and for re-exports
of Mainland origin to other places were 82% and 84% respectively.
In the first half of 1999, 52% of Hong Kong's total exports to the Mainland were
for outward processing; the figure was 76% for domestic exports and 49% for
re-exports. On the other hand, 81% of Hong Kong's imports from the Mainland were
related to outward processing. Over the same period, 88% of Hong Kong's
re-exports of Mainland origin to other places were produced through outward
processing in the Mainland.
The corresponding proportions in the first half of 1998 were 46% for total
exports to the Mainland, 76% for domestic exports to the Mainland, 42% for
re-exports to the Mainland, 81% for imports from the Mainland and 86% for
re-exports of Mainland origin to other places.
In value terms, $60.1 billion of Hong Kong's total exports to the Mainland in
the second quarter of 1999 were for outward processing, representing a decrease
of 2% over the second quarter of 1998. The value of domestic exports to the
Mainland for outward processing fell significantly by 19% to $9.9 billion whilst
the value of re-exports to the Mainland for outward processing rose by 3% to
$50.2 billion. Over the same period of comparison, the value of imports from the
Mainland related to outward processing dropped by 2% to $117.8 billion. On the
other hand, $135.0 billion of Hong Kong's re-exports of Mainland origin to other
places were produced through outward processing in the Mainland, representing a
slight increase of 1%.
In the first half of 1999, $107.4 billion of Hong Kong's total exports to the
Mainland were for outward processing, representing a 2% drop over the first half
of 1998. The value of domestic exports to the Mainland for outward processing
was down substantially by 17% to $17.4 billion whereas that of re-exports to the
Mainland for outward processing grew by 2% to $90.0 billion. Over the same
period of comparison, the value of imports from the Mainland related to outward
processing decreased by 2% to $217.1 billion. On the other hand, $255.8 billion
of Hong Kong's re-exports of Mainland origin to other places were produced
through outward processing in the Mainland, representing a slight decline of 1%.
Information on trade involving outward processing in the Mainland is collected
in a sample survey conducted by the Census and Statistics Department. For the
purpose of the survey, exports to the Mainland for outward processing refer to
raw materials or semi-manufactures exported from or through Hong Kong to the
Mainland for processing with a contractual arrangement for subsequent
re-importation of the processed goods into Hong Kong.
Imports from the Mainland related to outward processing refer to processed goods
imported from the Mainland, of which all or part of the raw materials or
semi-manufactures have been under contractual arrangement exported from or
through Hong Kong to the Mainland for processing.
Re-exports of Mainland origin to other places involving outward processing in
the Mainland refer to processed goods re-exported through Hong Kong, of which
all or part of the raw materials or semi-manufactures have been exported from or
through Hong Kong to the Mainland for processing with a contractual arrangement
for subsequent re-importation of the processed goods into Hong Kong. (The Hong
Kong General Chamber of Commerce, http://www.hkgcc.org.hk/member/infoserver/bb/manu/99101201.asp)