![]()
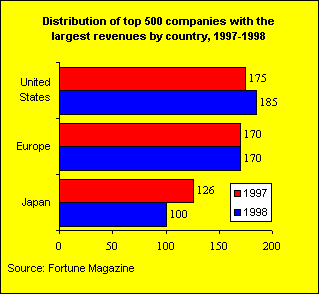
Largest corporationsMost of the largest companies, by revenue, are American or European. In 1998, 185 of the 500 largest companies globally were from the United States, and 170 from Europe. Germany had 42, France 39 and the United Kingdom 38 companies on the Fortune Global 500 list in 1998. (http://www.fortune.com)
|
 |
| Only a
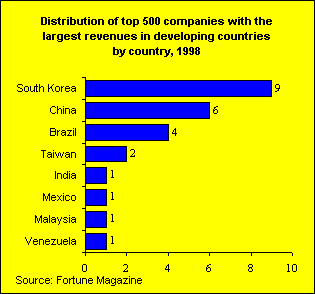
few of the largest companies are from developing countries. Exceptions are
South Korea and China. China made its debut on the Global 500 in
1995. There were six Chinese business giants on the list in 1998 -
in industries ranging from banking to energy - up from four the previous
year. (http://www.fortune.com)
Only nine of the South Korean companies made the Global 500 list in 1998, down from 12 in 1997. Daewoo, which was number 18 on the 1997 list got hit so hard by the Asian crisis that it did not appear on the 1998 list at all. |
 |
|
Measured by foreign assets, the distribution of the largest companies looks very much the same. Most of the top 100 companies with largest foreign assets are from the United States, Japan, France, Germany and the United Kingdom. In 1997, the list of the top 100 transnational corporations (TNCs), measured by foreign assets, included two companies from developing countries. These were Daewoo and Venezuela (oil company). Total foreign assets of the top 100 TNCs in 1997 amounted to $1.8 trillion, while total foreign sales were $2.1 trillion, and total employment 5,980,740, an increase of 0.7% over the previous year. (Fortune Magazine) |
|
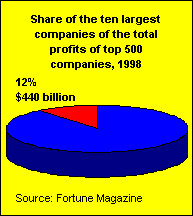
For many of the world's largest companies, 1998 was a difficult year. There was almost imperceptible 0.1% growth in revenues of the Global 500 companies. Profits fared even worse, sinking 2.6&, the first such decline since 1992. In 1998, the total revenues of the 500 largest companies globally were $11.4 trillion, total profits were $440 billion, total assets were $38.9 trillion, and the total number of employees was 39,685,624. (Fortune Magazine)
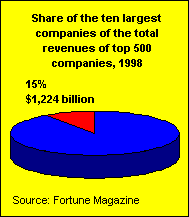
The top ten companies by revenues accounted for 15% of the total revenues of the top 500, 12% of profits, and 7% of employment, according to Fortune Magazine.
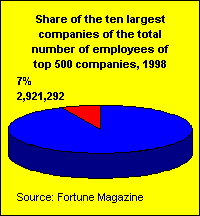
The largest employers among Global 500 companies are producers of electronics and electrical equipment. Companies representing this industry employed 3,649,669 people in 1998. Banks employed 3,521,262 people, producers of motor vehicles and parts 3,577,247 people and food and drug stores 3,109,232 people. (Fortune Magazine)
The largest single employers were China Petro-Chemical Corporation (1,190,000 people), Wal-Mart Stores (910,000 people) and United States Postal Service (904,636 people).
According to UNCTAD, the trend in 1990-1997 has been declining overall employment and rising foreign employment among the world's 100 largest transnational corporations ranked by foreign assets. Companies expanding the number of foreign employees operated mainly in the automobile or telecommunications industries.
The index of transnationality compiled by UNCTAD for the largest companies illustrates some aspects of the depth of a TNC's involvement abroad by comparing a firm's foreign assets/total assets, foreign sales/total sales and foreign employment/total employment. Since 1990, the average transnationality index of the top 100 TNCs has increased from 51% to 55%.
| Rank | Company | 500 Revenues Rank |
1998 Number Of Employees |
| 1 | China Petro-Chemical Corp. | 73 | 1,190,000 |
| 2 | Wal-Mart Stores, Inc. | 4 | 910,000 |
| 3 | United States Postal Service | 25 | 904,636 |
| 4 | General Motors Corporation | 1 | 594,000 |
| 5 | Industrial and Commercial Bank of China | 160 | 565,619 |
| 6 | DaimlerChrysler A.G. | 2 | 441,502 |
| 7 | Siemens AG | 22 | 416,000 |
| 8 | Ford Motor Company | 3 | 345,175 |
| 9 | United Parcel Service of America, Inc. | 135 | 333,000 |
| 10 | Hitachi, Ltd. | 24 | 328,351 |
| 11 | Sears, Roebuck and Co. | 50 | 324,000 |
| 12 | Volkswagen AG | 17 | 297,916 |
| 13 | General Electric Company | 9 | 293,000 |
| 14 | International Business Machines Corporation | 14 | 291,067 |
| 15 | La Poste | 254 | 288,015 |
| 16 | McDonald's Corporation | 361 | 284,000 |
| 17 | Matsushita Electric Industrial Co., Ltd. | 26 | 282,153 |
| 18 | Kmart Corporation | 75 | 278,525 |
| 19 | RAO Gazprom | 245 | 278,400 |
| 20 | Unilever N.V./ Unilever PLC | 43 | 267,000 |
| 21 | Deutsche Bahn AG | 230 | 252,468 |
| 22 | J.C. Penney Company, Inc. | 94 | 250,000 |
| 23 | Vivendi | 69 | 235,610 |
| 24 | NestlÚ S.A. | 36 | 231,881 |
| 25 | Columbia/HCA Healthcare Corp. | 190 | 229,500 |
| 26 | The Boeing Company | 29 | 227,000 |
| 27 | Royal Philips Electronics | 57 | 224,573 |
| 28 | Nippon Telegraph & Telephone Corporation | 18 | 224,400 |
| 29 | Deutsche Post AG | 244 | 223,863 |
| 30 | Fiat S.p.A. | 34 | 220,549 |
| 31 | Societe Nationale des Chemins de Fer Francais | 219 | 210,437 |
| 32 | Suez Lyonnaise des Eaux | 70 | 201,000 |
| 33 | ABB Asea Brown Boveri Ltd | 92 | 199,232 |
| 34 | Toshiba Corporation | 48 | 198,000 |
| 35 | Bank Of China | 171 | 197,547 |
| 36 | Deutsche Telekom AG | 53 | 195,876 |
| 37 | British Post Office | 407 | 194,000 |
| 38 | Robert Bosch GmbH | 105 | 189,537 |
| 39 | Fujitsu Limited | 51 | 188,000 |
| 40 | Toyota Motor Corporation | 10 | 183,879 |
| 41 | Metro AG | 32 | 181,282 |
| 42 | United Technologies Corporation | 125 | 178,800 |
| 43 | Sony Corporation | 31 | 177,000 |
| 44 | Bank of America Corporation | 35 | 170,975 |
| 45 | Citigroup, Inc. | 16 | 170,100 |
| 46 | Safeway Inc. | 138 | 170,000 |
| 47 | Lockheed Martin Corporation | 122 | 170,000 |
| 48 | France TÚlÚcom SA | 112 | 169,099 |
| 49 | Dayton Hudson Corporation | 89 | 165,750 |
| 50 | Koninklijke Ahold | 101 | 162,746 |
Source: Fortune Magazine
| Global developments In contrast to the 1950s and 1960s, when greenfield FDI was the most popular method of market entry, cross-border mergers and acquisitions have become an increasingly important means of entering foreign markets since the mid-1980s. According to UNCTAD, the total value of worldwide cross-border mergers and acquisitions (M&As) rose dramatically in 1998, for the eight year running. Majority-owned cross-border M&As reached $411 billion in value in 1998, up 74 per cent, after rising by 45 per cent in 1997. (UNCTAD, International Production Drives Globalization). According to KPMG, the upward trend in M&A activity continued in 1999. The value of international cross-border M&A activity rose by 47% from 1998 to 1999, up from $541 billion to a record high of $798 billion. (KPMG, KPMG Corporate Finance Millennium survey, KPMG is a business advisory firm operating in 155 countries. Its name derives from the initials of its principal founders: Klynveld, Peat, Marwick and Goerdeler.) |
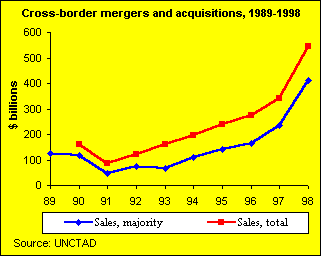 |
| Regional developments Most sales and purchases of companies take place within developed countries. But developed countries sell less than they buy, and the difference between the purchases and sales has grown in the 1990s. Conversely, developing countries sell more than they buy, and this difference has also grown in this decade. In 1998, purchases of companies by developed countries accounted for $527 billion, and sales $469 billion. Corresponding figures for developing countries are $17 billion and $68 billion. (UNCTAD, World Investment Report 1999)
|
 |
| Within developed countries, the largest net purchasers are found in
Western Europe. Since 1993, their purchases have increased continuously in relation to
sales. North America has become as popular as Western Europe for foreign
predators. US companies attracted a record $216 billion in mergers and acquisitions from
abroad in 1998, up from $77 billion in 1997.
Cross-border M&As in 1998 were characterized by greater geographical concentration and a larger number of exceptionally large transactions than in the previous years. The United States and the United Kingdom continued to be the countries with the largest sales and purchases. In 1998, the United Kingdom took over the first position in purchases from the United States. Together these two countries accounted for half of the total value of all cross-border M&As. (UNCTAD, World Investment Report 1999) KPMG Corporate Finance found that Western Europe was the world’s leading region for cross-border M&A deals in 1999. The region announced 73% by value ($582 billion compared to $327 billion in 1998) of the world’s cross-border deals, and attracted 45% of inward investment value. The UK, fuelled by deals such as Vodafone-Airtouch and Zeneca-Astra, was the world’s most acquisitive country for cross-border M&A deals in 1999 accounting for $245 billion ($117 billion in 1998) or 30% of total value. The next most acquisitive nations were the United States ($155 billion), Germany ($93 billion), France ($92 billion) and the Netherlands ($44 billion) during the year. The US was the leading country for inward deals in 1999 attracting a total of $293 billion or 37% by total value, compared to $191 billion in 1998, with major deals including Voadafone-Airtouch and Scottish Power-Pacificorp. The UK featured in second place, attracting $123 billion ($86 billion in 1998) of inward investment followed by Sweden, $59 billion ($6 billion in 1998), Germany, $42 billion ($38 billion in 1998) and France, $35 billion ($24 billion in 1998. (KPMG, KPMG Corporate Finance Millennium survey) In 1998, Japan became the 10th largest seller in the world, and maintained its position in 1999. While the imbalance between selling and purchasing still persists, the inward and outward cross-border M&As in value have become much more balanced in recent years. In 1999, the inward M&As accounted for $15.7 billion and outward M&As $20.4 billion.
|
 |
| All developing regions are primarily targets for international
companies, but an increasing number of companies from developing countries
have been involved as purchasers in recent years as well.
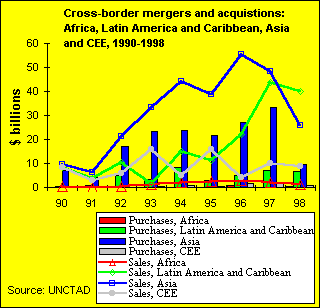
In Asia, the cross-border M&As declined sharply in 1998, purchases even more sharply than sales. In Latin America and Caribbean, the imbalance between sales and purchases is much larger than in Asia, and has grown constantly until 1998. In 1990-1999, inward M&As to Latin America have risen from $8 billion to $39 billion, Asia-Pacific from $16 billion to $56 billion and Eastern Europe from $6 billion to $13 billion. Outward M&As to Eastern Europe have risen from $0 to $330 million, Latin America from $372 million to $3 billion. Asia Pacific has remained fairly constant throughout the decade, from $33 billion in 1990, peaking at $50 billion in 1997 and in 1999 back to $33 billion. (KPMG, KPMG Corporate Finance Millennium survey) |
 |
Average value of cross-border deals
The average value of individual deals has risen in the 1990s. During 1999, the average value of a cross-border deal rose to $157 million, up nearly 50% on the equivalent figure of $106 million for 1998, illustrating the increasing power of larger corporates to close deals in the international M&A marketplace. Average value was $45 million in 1996 and $37 million in 1995. (KPMG, KPMG Corporate Finance Millennium survey)
The industry that recorded the largest cross-border M&As by value in 1998 was the oil industry , followed by the automobile industry and the banking and telecommunication industries.(UNCTAD, World Investment Report 1999)
Intra-firm trade plays a critical role in the operations of multinational companies. It may help an MNC to reduce costs, such as the distribution of goods or acquisition of inputs abroad, or it may help integrate production processes on a global scale. Intra-firm trade may respond differently to changes in economic conditions than trade between unrelated parties. For example, it may – at least in the short term – be more insulated from competitive forces in certain markets, or from overall changes in prices, exchange rates, or general economic conditions. Furthermore, prices that govern intra-firm trade – often termed "transfer prices" – may have their own unique characteristics and determinants.
Statistics on intra-firm trade are largely missing. An exception is the United States, which is the home country of most of the world's largest multinationals. The Bureau of Economic Analysis (BEA) has detailed statistics on US multinationals' operations and on foreign multinationals' operations in the US, including intra-firm trade.
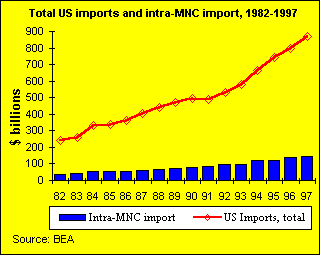
| Although fluctuating moderately during the past two decades, the share of
intra-firm trade in US
exports and imports of goods have changed very little. For both exports and imports,
intra-firm trade has mainly consisted of shipments from parents to their affiliates,
rather than shipments from affiliates to their parent companies. This trend is for both US
and foreign multinationals.
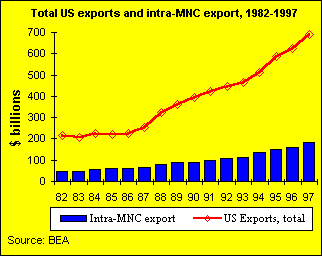
Goods shipped by US parents to their majority owned foreign affiliates (MOFAs) or other affiliates accounted for 22% of total US exports in 1982 and 26% in 1997. Goods shipped by MOFAs or other affiliates to their US parents accounted for 16% of total US imports in 1982 and 17% in 1997. (US Bureau of Economic Analysis (BEA), US intra-firm trade in goods and BEA, U.S. Multinational Companies: Operations in 1997)
|
 |
| The proportion in total imports of goods to the United States that is
accounted for by intra-firm imports of US multinationals has consistently been smaller
than the corresponding share of exports. US intra-firm exports of foreign MNCs have accounted for about 10% of total US goods exports since 1977; this share has fluctuated between 7% and 12%. US intra-firm imports of foreign MNCs have accounted for a much larger share of total United States goods imports since 1977 – about 20% or more. The share of imports increased substantially in 1984-1990, from 21% to 28%. Like exports, a very large proportion of the US intra-firm imports of foreign MNCs has been accounted for by Japanese-owned affiliates. (US Bureau of Economic Analysis (BEA), US intra-firm trade in goods and BEA, US Multinational Companies: Operations in 1997) |
 |
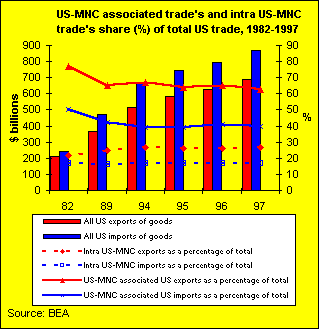 In 1997, U.S.-MNC-associated trade
- U.S. trade involving
U.S. parents, their foreign affiliates, or both - accounted for 63
percent of all US exports of goods and for 40 percent of all US imports of goods.
U.S.
MNC's accounted for a larger share of exports than of imports,
partly reflecting the
intrafirm sourcing patterns of MNC's; parents tend to be a much
more important source of supply to their affiliates than the
affiliates are to their parents. A substantial share of the remaining US exports and imports of goods
is associated with affiliates of foreign companies in the United States. (BEA,
US Multinational Companies: Operations in 1997)
The share in total US exports and imports accounted for by multinationals – both associated and intra-firm trade – has changed very little. Associated exports of MNCs declined from 77% in 1982 to 62% in 1995. Associated imports declined from 50% in 1982 to 39% in 1995.
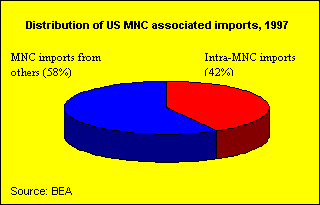
The share of intra-MNC-trade as a total of MNC associated trade is massive, both in exports and imports. Units of multinational corporations buy from each other almost as much as they buy from outside sources.
Of the $434 billion in US-MNC-associated exports in 1997, 42 percent represented trade between US parents and their foreign affiliates - intra-MNC trade - and 58 percent represented US-MNC trade with others.
Of the $350 billion in US-MNC-associated imports of goods in 1997, 42 percent represented intra-US-MNC trade, and 58 percent represented US-MNC trade with others. (BEA, US Multinational Companies: Operations in 1997)

The intra-firm trading patterns of US and of foreign MNCs in the United States are fundamentally different in terms of form and industry composition. The intra-firm trade of US multinationals reflects an international division of manufacturing production between affiliated parts of the MNC. For both exports and imports, most of this trade is between United States manufacturing parents and their foreign manufacturing affiliates. The intra-firm exports to these manufacturing affiliates have mainly consisted of materials and components for further processing or assembly. (Data on the intended use of imports into the United States from these foreign affiliates are not available.)
In contrast, the intra-firm trade in the United States of foreign MNCs is largely connected with distribution and marketing activities. For both exports and imports, US wholesale trade affiliates account for most of this trade. Imports by these affiliates from their foreign parent organizations consist almost exclusively of finished goods for resale. (Data on the intended use of exports by these affiliates are not available.) (BEA, United States Intrafirm Trade in Goods)
In 1992, the share of intra-firm exports in overall US exports varied widely according to country of destination. For example, among the top six US export markets – Canada, Japan, Mexico, the United Kingdom, Germany, and "Taiwan, China" – the intra-firm share ranged from 70% for Japan to 12% for "Taiwan, China". In addition, the proportion of intra-firm trade was particularly high for Switzerland (74%) and Russia (64%). For 24 of 62 countries included in available statistical information, the share of intra-firm exports was less than 10%. (BEA, United States Intrafirm Trade in Goods)
The share of intra-firm trade in overall US imports also varied substantially by country. Among the top six source countries for imports into the United States – Canada, Japan, Mexico, Germany, China, and "Taiwan, China" – the share ranged from 71% for Japan to less than 10% for China and "Taiwan, China". For Germany, the share was 61%. In addition to Japan and Germany, intra-firm trade accounted for a majority of United States imports from seven other countries; the share was highest for imports from Switzerland (76%). In addition to China and "Taiwan, China", intra-firm trade accounted for less than 10% of United States imports from 19 other countries. (BEA, United States Intrafirm Trade in Goods)
Intra-firm transactions – particularly shipments flowing from parent companies to their affiliates – tend to be relatively more important in US trade with higher-income countries. Among 59 major US trading partners, there is a pronounced tendency for the proportion both of intra-firm exports of US MNCs in total exports and of intra-firm imports of foreign MNCs in total imports to increase with the per-capita gross national product (GNP) of the trading partner. The average share of US exports accounted for by intra-firm trade of US MNCs increases from 4% for the 11 trading partners with per-capita GNP of less than $1,000, to 23% for the 14 trading partners with per-capita GNP of $20,000 or more. The average share of US imports accounted for by intra-firm trade increases from less than 3% for the 11 countries with the lowest per-capita GNP, to 35% for the 14 countries with the highest per-capita GNP. (BEA, United States Intrafirm Trade in Goods)
Cross-border agreements between firms based in different countries have become increasingly important complements to traditional FDI activities, with the range of such agreements growing ever wider. They include arrangements for joint ventures, licensing, subcontracting, franchising, marketing, manufacturing, research and development (R&D), and exploration agreements. These may be equity-based, or may entail no equity participation. (UNCTAD, World Investment Report 1997.)
| The number of these agreements (apart from strategic R&D partnerships) increased from 1,760 in 1990 to 4,600 in 1995. Most cross-border inter-firm agreements concluded during the period 1990-1995 involved firms from the three major industrial centres: firms from European Union countries participated in 40% of such agreements, Japanese firms in 38%, and United States firms in 80%. (UNCTAD, World Investment Report 1997.) |  |
| Developing countries are becoming increasingly involved in cross-border agreements, especially in those that are equity based. The number of new cross-border inter-firm agreements with developing country participation increased from around 440 in 1990 to some 2,120 in 1994, but fell to 560 in 1995. Their share in the total number of cross-border inter-firm agreements increased on average from 27% in 1990-1992 to 35% in 1993-1995. In contrast, the corresponding share of Central and Eastern European participation in cross-border agreements was halved over the same time frame. (UNCTAD, World Investment Report 1997.) | 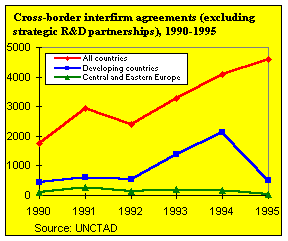 |
| The number of cross-border strategic R&D partnerships increased from nearly 280 in 1991 to 430 in 1993. The upward trend continued in 1994, but faltered in 1995. Most cross-border non-equity strategic R&D partnerships have been between firms from developed countries. In 1995, out of the total number of such agreements for which the countries of the participating firms are known, 86% had at least one United States partner, 42% had at least one partner from the European Union, and 31% had at least one Japanese partner. However, developing-country firms are also becoming more involved in these partnerships. The participation of developing countries in the total number increased from 3% in 1989 to 13% in 1995. (UNCTAD, World Investment Report 1997.) | 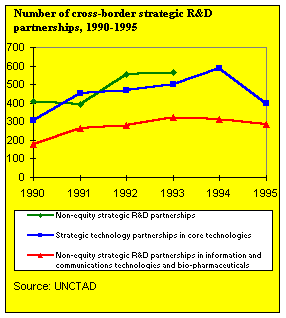 |