Japan External Trade Organization
Table 2: Real
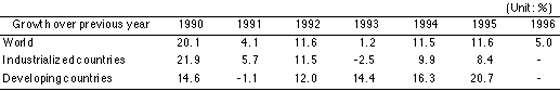
global GDP growth rate
Table
3: Ratio of GDP to World Trade
Table 5: Growth of Exports and Imports by region/country
Table 6: Exchange rates of major currencies against the U.S. dollar
Table
7: Trends in global service export growth
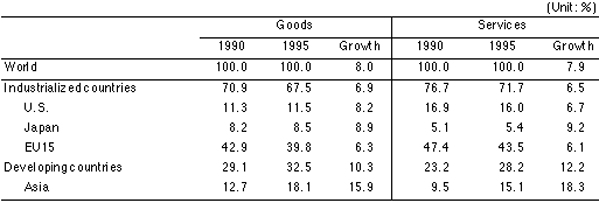
Table 8: Shares of growth of global goods and service exports
Table 9-1: Top countries/regions in exports and imports of services
Table 9-2: Service trade balance of top 10 exporters
Table 10: Share and growth by service export category
Table 11:
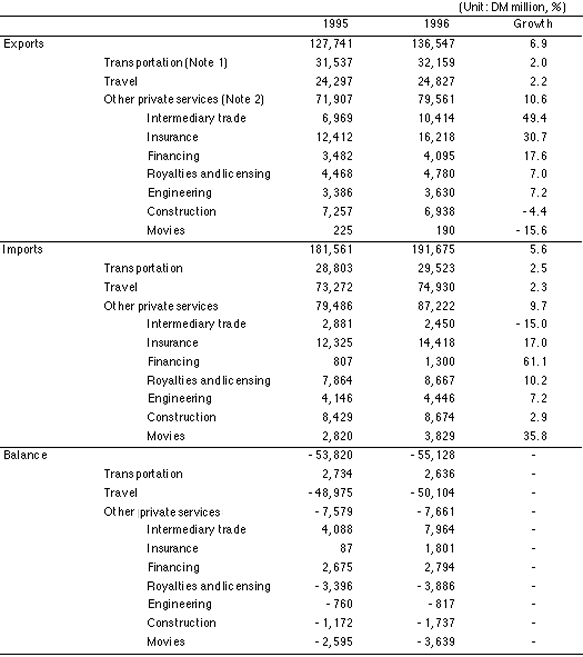
Service Balance in Germany
Table 12:
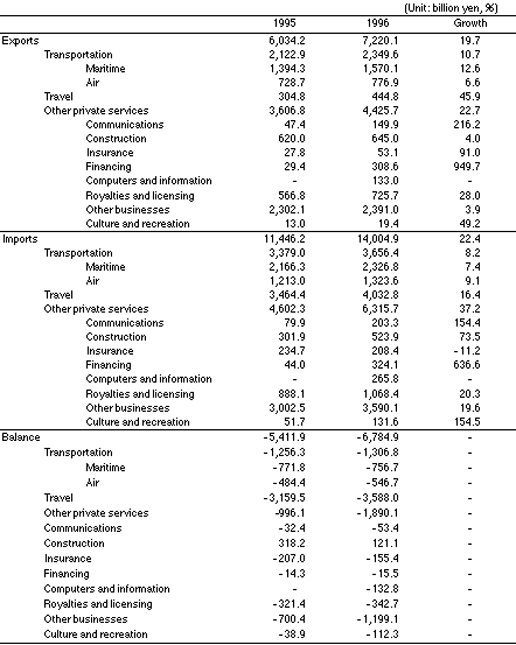
Service balance of Japan
Table 13:
Service balance of U.S.
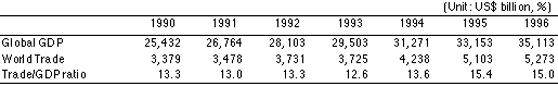
In 1996, global trade (based on exports) rose 3.3 percent from the previous year to reach US$5,273.0 billion. This represented a major slowdown compared with the 20.4 percent hike seen in 1995.
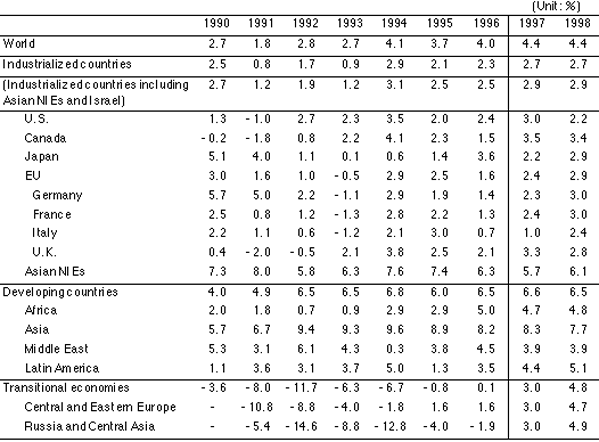
The real GDP growth rate of the world, which had stood at 3.7 percent in 1995, edged up slightly to 4.0 percent in 1996. (Table 2)
As a result, the ratio of the trade in goods in the world economy declined slightly from the 15.4 percent of 1995 to 15.0 percent in 1996 (Table 3).
On the other hand, intra-regional trade continued to grow by a relatively high rate. The exceptions were the Asian NIEs and AFTA, both of which grew by only 1 to 2 percent.
(1) One of the reasons why the growth rate in global trade was blunted compared with the growth rate of the global economy was the switch in the countries driving economic growth in both the industrialized and developing countries. Specifically, Japan became the major driving force among the industrialized countries in 1996 instead of the EU (with the growth rate of the EU falling from 2.5% to 1.6% and that of Japan rising from 1.4% to 3.6%). Among the developing countries, the growth rate of the Asian countries slowed a bit, but was compensated for by faster growth in Latin America, the Middle East, and Africa.The problem is that the trade of Japan and these other countries and regions did not grow commensurately.
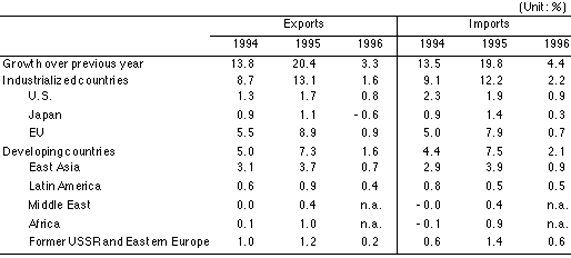
(2) Looking at this from the perspective of the degree of contribution to the growth of global trade, there was a remarkable drop in the degrees of contribution of the EU and East Asia to export growth from the previous year (EU down from 8.9% to 0.9% and East Asia down from 3.7% to 0.7%). (Table 5) Further, the degree of contribution of Japan to export growth was a minus figure in 1996. Even its degree of contribution to import growth came in at a low 0.3 percent. Further, the contribution of Latin America had little effect since the region originally represented only a minor part of global trade.
(3) Exchange rates were a major cause of this blunting of growth in global trade in 1996 when viewed on a dollar basis. A look at the exchange rates of the major currencies of the world against the U.S. dollar in 1995 and 1996 shows that the currencies of Japan and the leading countries in the EU all sharply lost value after previously having gained tremendous ground. Extreme changes were experienced. (Table 6) Given the fact that the U.S., Japan, and the EU alone account for just under 60 percent of the world's exports, the upward valuation of the currencies of Japan and the EU against the U.S. dollar in 1995 followed by the loss in value in 1996 had a large impact on the scale of global trade when viewed on a dollar basis.
(4) Comparing intra-regional trade against the growth of the global economy as a whole, trade in NAFTA rose 9.5 percent from the previous year while trade in Mercosur jumped 13.0 percent - both considerably high levels. In Asia, however, the global scale recession in semiconductors and the slump in demand for electronics blunted the exports of the Republic of Korea and Singapore. This pulled down the rate of growth of trade in the Asian NIEs and caused growth in trade in AFTA to falter as well. Added on to this was the fall in Japanese exports (based on the U.S. dollar). Growth in trade in East Asia and in APEC was fettered as a result.
Global trade in services in 1996, according to WTO estimates, rose 5 percent from the previous year to US$1.2 trillion (Table 7). When the US$5.3 trillion in trade in goods is added on to this, trade in goods and services accounted for about 20 percent of the global economic activity in 1996.
Trade in services is dominated by the industrialized countries. While they have been yielding ground with each passing year, the industrialized countries still account for 70 percent of the total trade in services (based on exports, same below) (Table 8).
Further, the top 10 countries account for 60 percent of the total exports (Table 9-1).
Among these top 10, Germany and Japan have been running trade deficits in services. Analysis of the individual components of the service trade of the two countries suggests that these deficits will continue in the future as well.
(1) In the first half of the 1990s, global trade in services grew by substantially the same pace as the trade in goods. A closer look, however, reveals that (a) the rate of growth in the trade of both goods and services was higher in the developing countries than the industrialized ones, (b) growth was particularly high in the service trade in the developing countries - approximately double the growth of the industrialized countries, and (c) in the service trade of the developing countries, the rates of growth were greatest in "other private services" such as insurance and fees for intermediary trade (Table 8 and Table 10).
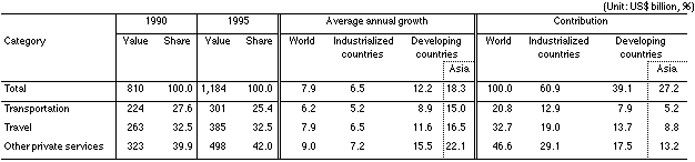
(2) Among the top 10 countries in trade in services, Germany and Japan are running deficits. The characterizing features of the two countries are (a) travel being the main culprit behind the deficits, (b) "other private services" also being serious contributors. Although differences can be seen between the two in that Germany is running a surplus in financing and Japan in construction. However, both countries are paying out more in patent licensing fees and for cultural and recreational activities than they take in and the sheer size of these deficits are making the deficit tone of "other private services" immutable even if surpluses were run in all other areas (Table 11 and Table 12). and (c) transportation also runs a deficit. Although Germany is showing a surplus in international balance of payment statistics of the Bundesbank, it is believed to be running a deficit like Japan when calculated by the IMF methodology. In addition, considering the high degree of use of private foreign air carriers in the two countries and the low rate of use of their own cargo vessels, there is little chance that the deficit in transportation will change to a surplus in the short term (Table 14).
(3) As opposed to this, the U.S., the world's largest trader in services, enjoyed a surplus in all parts of the service trade in 1996 (Table 13).
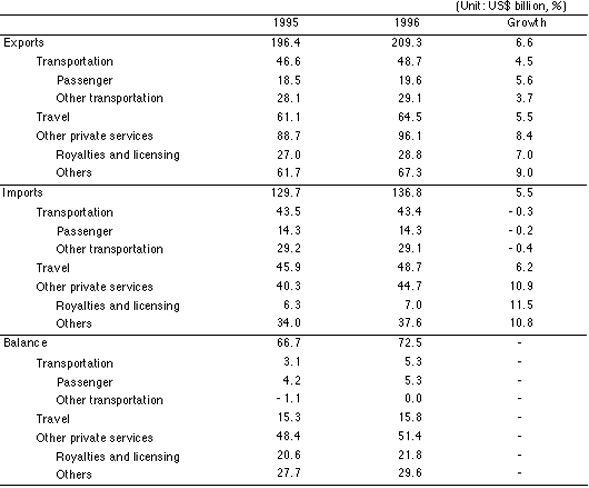
Specifically, in the U.S. case, the number of foreign tourists hosted ran to just under 45 million or second only to the 61.5 million of France. Private air carriers engaged in conveying these foreign passengers are highly competitive. In transportation, a system is set up to contribute to exports of transportation services what with, for example, mandates for use of American vessels for some transportation.
In patent licensing fees, the U.S. enjoys the world's largest surplus - receiving over US$20 billion. The U.S. is also strong in the fields of attorney and accountant services and in the financial and insurance fields. Further, the U.S. accounts for an extremely high share in the field of international communication in terms of existing infrastructure. For example, the U.S. holds a 23.8 percent share of the number of telecommunication lines in the world.
(4) Japan recorded the largest surplus in the trade of goods among the G7 (US$83.4 billion or 1.8% of its GDP in 1996), but had only a US$21.3 billion surplus when viewing the balance of both goods and services (0.5% against its GDP) placing itself third from the bottom. On the other hand, the U.S. recorded a US$111.1 billion deficit in its trade of goods and services (1.5% against GDP) - the highest level among the G7 members in the trade of goods.