![]()
Equity prices in industrial countries have risen strongly in the 1990s, with the increase in Japanese prices being somewhat less pronounced. The US equity market has clearly been the star performer of the 1990s. Although the rise in United States markets since early 1996 has been matched or exceeded by that in other advanced equity markets, US markets have outperformed most other advanced equity markets since the beginning of the decade, in some cases by a factor of two or more. (See International Monetary Fund (IMF), International Capital Markets – Figures on Stock Market Indices, 1990-May 1997 http://www.imf.org)
For the US equity market, 1997 was a year of superlatives, in spite of warnings of overvaluation and (late in the year) concerns about the impact of the Asian crisis. The Dow Jones Industrial Average (DJIA) registered a record third consecutive increase of over 20 percent, and the best 10-year performance on record. Performance of European equity markets was also exceptional during 1997, with many markets setting records in local currency terms, and some European markets outperforming the US market even in dollar terms. In contrast to other major markets, the Japanese stock market languished in 1997. The Nikkei lost about 25% of its end-1996 value by the end of 1997, as concerns about the financial sector grew in late November 1997 following the failure of several financial institutions, including the fourth largest brokerage firm and a major city bank.
All major mature equity markets staged impressive recoveries from the depths of the turbulence in October 1998. However, some markets performed much more strongly than others during the 12 months ending June 1999. In local currency terms, US stocks rose by about 20% since end-June 1998; broad indexes of European stocks rose by about 5–10% (though some country indexes have fallen); Japanese stocks have risen by about 10% (and have been unusually volatile over the intervening 12 months). (IMF, International Capital Markets Report 1999)
See also portofolio investments
Market capitalization and listed companies
| Equity markets in emerging developing and transition
economies grew rapidly in the 1990s. Their market capitalization - the
market value of the shares of all companies listed on the exchanges -
increased more than threefold between 1990 and 1996, the peak year. This
reflected strong expansion in Asia and Latin America.
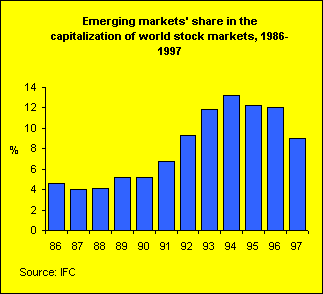
As a result, the share of the emerging markets in the capitalization of world stock markets increased from about 6% in 1990 to almost 12% in 1996. According to the International Finance Corporation, this share dropped to 9% in 1997. The number of listed companies in emerging markets was 18,800 and their market value was $2.3 trillion. (Emerging Stock Markets Factbook 1998) The following are considered emerging markets: all countries in Latin America and the Caribbean; all markets in Asia except Australia, Hong Kong, Japan, New Zealand, and Singapore; all countries in Africa and the Middle East except Israel; all former Eastern Bloc countries, Russia and the Commonwealth of Independent States; and Greece, Portugal and Turkey. |
 |
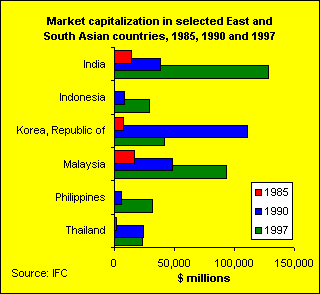
| The development of several markets in East and South Asia
began to take off in the 1980s and their expansion continued at a rapid
pace in the 1990s. In Korea, the market capitalization increased from $7
billion in 1985 to $110 billion in 1990. In 1997, equity prices declined
sharply in East and South Asia. In Korea, the market capitalization decreased
to $42 billion in 1997. (IMF, International Capital Markets 1999)
The number of listed companies has grown too, but much less rapidly than the market value of the companies. A small number of companies usually account for a disproportionate share of the market. Asian markets are generally the least concentrated, with the share of 10 largest stocks accounting for about 25 to 50% of total market capitalization. (UN, World Economic and Social Survey 1999) |
 |
| Asian markets are also least concentrated among emerging markets in terms of total value traded. The turnover value - the ratio of traded value to market capitalization - was 131% in East and South Asia in 1997. (UN, World Economic and Social Survey 1999) | 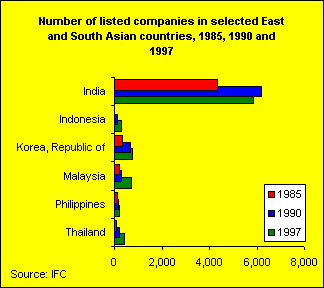 |
| The acceleration in stock market growth in the 1990s was
most pronounced in Latin America, where capitalization of the major
markets increased almost eightfold in the 1990-1997 period.
A decade ago, securities markets were a barely noticeable part of the financial sector of most Latin American countries, which has always been dominated by banks. Consider the example of Argentina. Although the Buenos Aires stock exchange has existed for over a century, as recently as 1990 its market capitalization was a trivial $3 billion, according to the United Nations. (World Economic and Social Survey 1999) But over the next few years things changed in Latin America dramatically. Market-oriented trade and financial reforms stabilized the economy and facilitated foreign direct investment. Ambitious privatization plans gave ordinary investors access to something they had rarely had before: the opportunity to buy shares in a list of premium industrial companies. Millions of dollars of savings that had been parked in foreign banks were repatriated to buy these shares, and European and US investment funds soon followed suit. The result was a spectacular run-up in the stock market. Despite a serious downturn following the Mexican peso crisis in 1995, the market capitalization of the Buenos Aires exchange had reached $60 billion by year-end 1997. According to the International Finance Corporation, the total market capitalization of the region's principal exchanges hovered around $37 billion in 1987. By the end of 1997 it stood at $595 billion. However, the region's eight largest economies account for more than 90 percent of total market capitalization. Brazil represents slightly less than half of the total. Mexico, Chile and Argentina dominate the remainder, while exchanges in Colombia, Peru and Venezuela together have a market capitalization of some $50 billion. Market capitalization in the rest of the region's countries combined amounts to a little more than $5 billion |
 |
| Yet these figures are not as impressive as they seem on the
surface. To begin with, Latin America's capital markets are still very
small when measured against their underlying economies. In 1997, the
region's total market capitalization amounted to around 32 percent of its
gross domestic product.
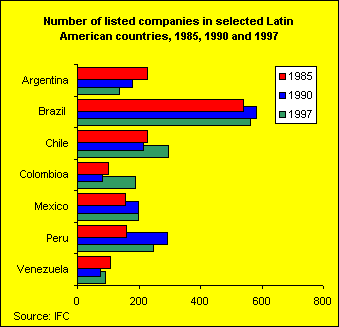
Moreover, Latin America's stock market boom is primarily benefiting a handful of recently privatized utilities and blue-chip industrial firms. Although the region's larger exchanges boast several hundred listed companies, the bulk of their market capitalization and trading volume are accounted for by a handful of giant telecommunications and energy firms. In Brazil and Mexico, around half of the market's trading volume on a typical day corresponds to the stock of each country's dominant telephone company. In other words, the vast majority of Latin America's companies are still not obtaining capital from stock markets. Despite the very impressive gains in capital market development, the region's banks are still the overwhelmingly dominant source of financing for the private sector. By contrast, banks in the United States meet only 20 percent of overall corporate financing needs. Companies obtain cheaper and more flexible financing by issuing stocks, bonds and commercial paper directly to investors, through various securities markets and exchanges. (Inter-American Development Bank (IADB), Stock Anxiety) |
 |
The volatility of returns on emerging equity markets - in both Asia and Latin America - had declined
steadily and dramatically during the course of 1996 and through early 1997 as recovery from the Mexican crisis continued. By mid-1997 these volatilities were comparable to, and in fact slightly below, those in the mature equity markets. This situation changed drastically in the second half of 1997, as the volatility of returns on Asian emerging markets rose steeply, to levels in excess of those on Latin American markets at the height of the Mexican peso crisis.Returns on emerging equity markets fluctuated
sharply during the course of 1997 and diverged markedly across regions. Latin American markets remained extremely buoyant during the first half of the year, turning in total dollar returns, as measured by the IFCI investable index, of 40%, about double that of the Standard and Poor’s (S&P) 500 index. Asian markets, on the other hand, declined modestly by 4%. During the second half of 1997, as sharp depreciations in exchange rates combined with declines in local currency equity prices, dollar returns on Asian equity markets went into a free fall, yielding a loss of 56%. Latin American markets, on the other hand, after suffering an early sympathetic correction with the Asian markets in July, rebounded, continuing to yield positive returns through the third quarter, albeit more modestly than earlier in the year. Having turned in returns of 46% during the first three quarters of the year, how-ever, as a result of the spillover from Hong Kong SAR’s equity markets in late October, Latin American markets fell by 12% in the fourth quarter.Emerging markets' performance was mixed in 1997, with steep losses in Asia and strong gains in Latin America highlighting some of the disparities in emerging market equity performance. Overall, markets performed poorly in 1997, with the IFC Investable Composite Index (IFCI) falling more than 16%, the sharpest one-year decline in the index's 10-year history. The sharp 57% fall in the IFCI Asia Index easily outweighed the 10% rise in the IFCI Europe/Mideast/Africa (EMEA) Index and the nearly 26% rise in the IFCI Latin America Index. The 32-market IFC Global (IFCG) Composite Index posted similar results to the IFCI Composite Index. The IFCG Asia Index fell 44%, less than IFCI Asia, largely due to strong gains in Chinese A-shares, which are not open to foreign investment. In contrast to emerging market returns, the U.S. S&P 500 surged 31% for the year, beating all but eight of the 32 IFCG market indexes. Other developed stock market returns, with the exception of those in Asia, were generally strong across the board. (IFC, Emerging Markets Factbook 1998)
In 1988, the IFC Composite Index fell 24% and underperformed the FT/ S&P World Price Index by about one-third in US dollar terms. IFC Latin American index showed a return of -36% in 1998 and Asian index a return of -1%. But not all markets caused grief. The best IFC index performer was South Korea, which rose 92 per cent in dollar terms over the year.
The IFC Investable (IFCI) Composite Index, consisting of 1,224 stocks in 26 markets, is the broadest index available. It is designed to measure returns on emerging-market stocks that are legally and practically open to foreign portfolio investment, and is a widely used benchmark for international portfolio management purposes. The IFCI Composite gained 6.7% in 1996.
A mutual fund is an open-end investment company that pools money from shareholders and invests in a diversified portfolio of securities. Unlike closed-end funds, which issue a fixed number of shares, open-end mutual funds are obliged to redeem shares at the request of the shareholder. When a shareholder redeems shares, he or she receives their net asset value, which equals the value of the fund’s net assets divided by the number of shares outstanding. An investment manager determines the composition of the fund’s investment portfolio in accordance with the fund’s return objectives and risk criteria.
There are four basic types of mutual funds: stock (or equity) funds, bond and income funds, hybrid funds and money market funds. Money market funds are referred to as short-term funds, because they invest in securities that generally mature in about one year or less. Stock, bond and hybrid funds, on the other hand, are known as long-term funds. Hybrid funds are a mixture of stock and bond funds, i.e., they invest in a combination of stocks, bonds and other securities.
An investor in a mutual fund is a shareholder, buying shares of the fund. Each share represents proportionate ownership in the fund’s underlying securities. The securities are selected by a professional investment adviser to meet a specified financial goal, such as growth or income. The Investment Company Institute classifies mutual funds into 21 broad categories, according to their basic investment objective (See the categories).
Mutual funds have been on the financial landscape for longer than most investors realize. In fact, the industry traces its roots back to 19th-century Europe, in particular to Great Britain. The Foreign and Colonial Government Trust, formed in London in 1868, resembled a mutual fund. It promised the "investor of modest means the same advantages as the large capitalist… by spreading the investment over a number of different stocks." Most of the early British investment companies and their American counterparts resembled today’s closed-end funds. They sold a fixed number of shares, the price of which was determined by supply and demand. (As a source for this section, see: Investment Company Institute (ICI), Mutual Fund Fact Book 1999 and ICI, Perspective, February 2000. http://www.ici.org) The first modern mutual fund was the Massachusetts Investors Trust, which was introduced in March 1924 and began with a modest portfolio of 45 stocks and $50,000 in assets. This was the first so-called open-end mutual fund. It introduced concepts that would revolutionize investment companies and investing: a continuous offering of new shares and redeemable shares that could be sold anytime based on the current value of the fund’s assets. |
 |
|
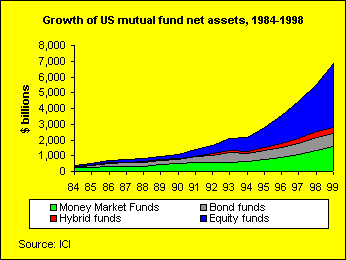
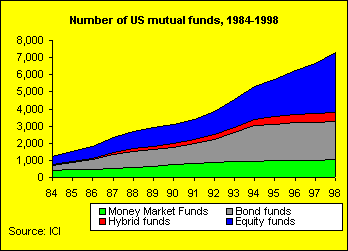
The early mutual fund industry was, however, overtaken by events – namely, the 1929 stock market crash and the Great Depression. Mutual funds began to grow in popularity in the 1940s and 1950s. In 1940, there were fewer than 80 funds in United States, with total assets of $500 million. Twenty years later, there were 160 funds and $17 billion in assets. However, truly significant amounts of money did not start flowing into the funds until the mid-1980s. The complexion and size of the mutual fund industry dramatically changed as new products and services were added. The first international stock mutual fund was introduced in 1940; today there are scores of international and global stock and bond funds. Before the 1970s, most mutual funds were stock funds, with a few balanced funds that included bonds in their portfolios. By 1972, there were 46 bond and income funds in United States, and another 20 years later, there were 1629. |
 |
Innovations in investment and retirement vehicles have also swept the industry. In 1971, the first money market mutual funds were established, which offered cheque-writing capability and higher interest rates than bank savings accounts. The mutual fund industry also began to introduce even more diverse stock, bond, and money market funds. Today’s mutual funds run the gamut – from aggressive growth funds, to global bond funds, to single-state tax-exempt money market funds, to "niche" funds that may specialize in one segment of the securities market.
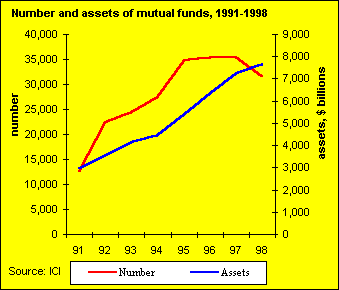
| The number of mutual funds worldwide has grown rapidly in the 1990s, and
mutual fund assets have increased even more rapidly. At the end of 1998, there were
31,570
mutual funds, with $7,652 billion in assets. The number of funds decreased somewhat in
1997, but the value of total assets increased. (ICI, Mutual
Fund Fact Book 1999, http://www.ici.org)
The number of non-US mutual funds decreased from 29,170 in 1996 to 28,647 in 1997 and to 24,322 in 1998. In Japan, the number decreased from 5,879 in 1996 to 5,203 in 1997. In Brazil, the number decreased from 2,254 in 1997 to 1,568 in 1998. Also the assets of non-US mutual funds decreased from the peak of $2,815 billion in 1996 to $2,778 billion in 1997 and $2,761 billion in 1998. |
 |
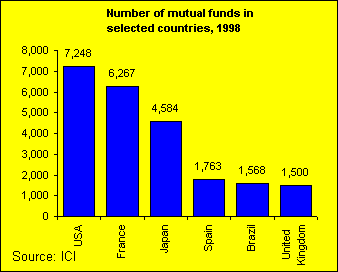
| Most of the mutual funds are based in the United States,
France and Japan. The distribution of fund assets is even more uneven. Approximately half of the worldwide total in mutual fund assets belongs to US mutual funds, even though only one-fifth of the total number of funds are based there. Large size is typical of US funds. Assets of US mutual fundes increased 24% in 1998 and 24% also in 1999. The year 1999 was the fifth consecutive year of more than 20% growth. |
 |
| The US mutual fund assets totaled $6.8 trillion in 1999.
About one-quarter of the growth in 1999 was attributable to net new
investments by mutual fund shareholders; most of the remainder came from
the investment performance.
See also Fortune Magazine's lists on top funds in each fund category: aggressive growth funds, balanced funds, convertible bond funds, corporate high yield funds, corporate general funds, equity income funds, global/world stock funds, government general funds, government mortage funds, government Treasury funds, growth funds, growth and income funds, international stock funds, municipal national funds, small company funds, world funds (http://www.fortune.com) |
 |
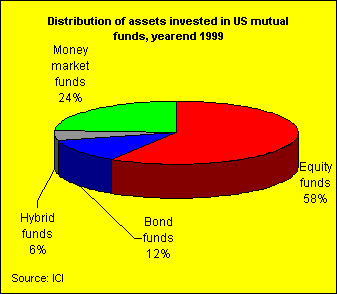
| Of the total $6.8 trillion invested in US mutual funds, $4 trillion
was invested in stock funds, $808 billion in bond funds, $384 billion
in hybrid funds and $1.6 trillion in
money market funds.
US equity mutual fund assets increased 36%, hybrid funds 5% and money market funds 19%, while bond funds fell 3% in 1999. An increasing proportion of US mutual fund assets was invested outside the United States until the Asian crisis. There are at least three types of mutual funds that may invest abroad: international mutual funds, global mutual funds and emerging market mutual funds (See types of mutual funds)
|
 |
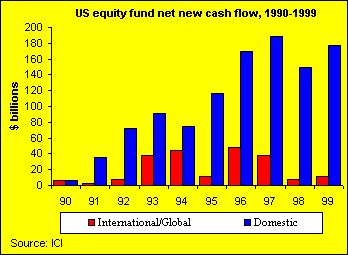
| Since the Asian crisis much less cash has been flowing to
the US international/global equity funds than to US domestic equity funds.
Net new cash flow to US domestic equity funds rose to $177 billion in 1999
from $150 billion in 1998.
Even though domestic equity funds collectively experienced an increase in net new cash flow in 1999, net flows across individual domestic equity funds were more concentrated than normal. The 10% of domestic funds with the largest inflows had a total net new cash flow of $286 billion in 1999, meaning that the remaining 90% combined for a net outflow of $109 billion. Reflecting the greater concentration of net flows, the percentage of domestic equity funds posting a net inflow declined to 58% in 1999 from 65% in 1998. Between 1991 and 1998, the percentage of domestic funds with a net inflow fluctuated between 63% and 74%. Net new cash flow to US global/international equity funds rose from $8 billion in 1998 to $11 billion in 1999. In 1996, $48 billion flew to these funds. |
 |
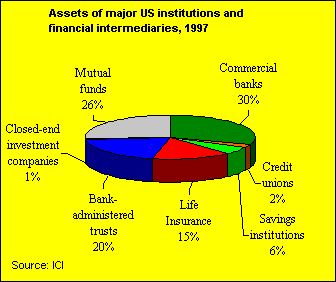
Assets of mutual funds have grown much more rapidly than the assets of commercial banks or any other US financial intermediaries. While in 1992 the share of mutual funds in total assets of major US financial intermediaries* was 16%, by 1997 it had reached 26%. Besides mutual funds, bank administrated trusts and insurance companies have also increased their share, but much less impressively.
Assets of mutual funds totaled $4.4 trillion, and assets of commercial banks totaled $5.1 trillion in 1997. However, as mentioned earlier, the assets of mutual funds have increased significantly since, totaling $6.8 trillion in 1999.
 |
 |
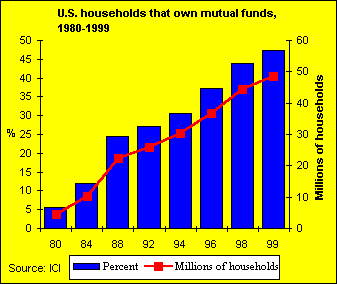
| In the United States, households own the
majority of the mutual fund industry’s assets. As of year-end 1998,
they held $3 trillion of mutual fund assets, representing 55% of total
mutual fund assets, while institutions held the remaining $2.5
trillion. (ICI, About mutual fund shareholders) An estimated 48.4 million, or 47.4%, of all US households owned mutual funds in 1999, up 9% from 44.4 million in 1998. (ICI, Fundamentals Vol. 8/No. 5) Fund ownership tends to increase with income. 24% of US households belonged to an income category of less than $25,000, but only 8% in this income category owned mutual funds in 1999. 22% of US households belonged to an income category of $50,000-74,999, but 30% in this income category owned mutual funds in 1999. |
 |
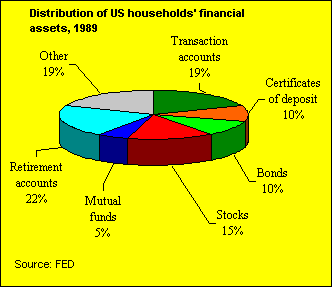
| Households have
directed a significantly higher proportion of their financial assets to securities in recent
years. Growth over nine years period was concentrated among stocks, mutual
funds, tax-deferred retirement accounts, and other managed assets;
together these assets accounted for 48.4% of financial assets in 1989 and
71.3% in 1998.
The share of deposits has decreased correspondingly. In 1989, transaction accounts and certificates of deposit accounted for 29% of the US households financial assets, but only 15% in 1998. (The Federal Reserve System, Federal Reserve Bulletin, January 2000, http://www.fedreserve.gov) |
|

The growth in mutual fund assets worldwide is part of the overall growth in both the size and maturity of many foreign capital markets. There are several reasons why this growth has occurred. First, the securities markets of many developed countries have benefited in recent years from favourable economic conditions. For example, Canada and Western Europe have experienced low interest and inflation rates, which have enhanced the attractiveness of their capital markets for investors worldwide. (As a source for this section, see: ICI, Mutual Fund Fact Book 1997.)
Securities markets in some emerging markets have prospered because of new investment opportunities arising from economic reform, privatization, lowered trade barriers, and rapid economic growth. For example, the emerging markets of Malaysia, Mexico, "Taiwan, China", and Korea are now among the 15 largest equity markets in the world.
At the same time, demand for capital has risen – especially in emerging markets. For mutual funds, emerging markets mean possibilities to diversify risks and benefit from higher returns. Domestic firms benefit from funds through improved access to equity capital, and in the case of venture capital funds, through management input (strategic and financial planning, marketing, etc.). The infusion of foreign capital into local equities markets has improved liquidity and raised price-to-earnings ratios, thus reducing the cost to firms of issuing new capital.
Among investors, mutual funds are popular because throughout the world they share many of the same basic needs and goals – a comfortable retirement, higher education for their children, and improved family living standards. Investors are turning to mutual funds for diversification and as a way to participate in growing securities markets. Professionally managed funds are a viable alternative for investing directly in securities. In addition, as many countries begin to face the prospect of aging populations, they are considering the need for increased private savings to meet retirement needs.
Countries such as Chile have enacted new pension systems that place greater emphasis on the role of private investment in retirement savings. Mutual funds are often used as funding vehicles for such systems.