| Note: | Like Japan, the Indonesian fiscal year starts in April. The fourth quarter of fiscal 1997 therefore corresponds to the first quarter of 1998. |
| Source: | Prepared by JETRO from Bank Indonesia statistics. |
Japan External Trade Organization (JETRO)
The five countries most affected by the 1997 Asian currency crisis--Indonesia, Malaysia, the Philippines, R.O.K. and Thailand--began courting foreign capital in an attempt to accelerate the process of economic recovery. Measures include easing restrictions on M&As by foreign firms and on foreign equity ownership. The amounts of FDI received since 1997 by countries affected by the crisis has varied from country to country, depending on local factors, but there has generally been a clear rise in the number of M&As.
The importance of the Asian Newly Industrialized
Economies (NIEs) as sources of FDI has increased in recent years,
but whereas FDI outflow from Taiwan remained high from 1997 through
the first half of 1998, FDI by the R.O.K. slumped. Consequently,
in Vietnam, where the R.O.K. was a major source of investment,
FDI inflow shrank. The currency crisis has thus had a ripple effect
on countries not initially affected (Table 15).
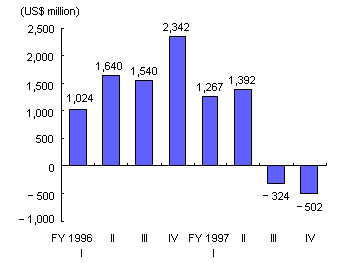
(1) Table 2 shows that there was a conspicuous drop in FDI in Asia in 1997. Investment in the Asian NIEs, excluding Hong Kong Special Administrative Region (SAR), increased 18.0% on 1996 to US$13.7 billion, and in the ASEAN4 it was down 7.0% to US$14.1 billion. Investment trends within ASEAN varied. Whereas there was a sharp drop of 24.5% to US$4.7 billion in Indonesia, FDI entering Thailand rose 29.7% to US$3.0 billion. The latest balance of payments (BOP) statistics indicate that the contrast in the investment situation in these two countries continued into 1998, with FDI in Thailand rising during the first six months of 1998, while FDI entering Indonesia resulted in a net withdrawal between October 1997 and March 1998 (Tables 10, 11). The net withdrawal of investment from Indonesia appears to have been a result of the political turmoil caused by the currency and economic crises.
(2) The countries hit by crises have come to recognize once again that unlike fickle short-term funds, direct investment can help make an economy sound. They have consequently sought to improve their investment environments to attract FDI by, for example, reviewing which industries should be covered by investment regulations and by relaxing and abolishing foreign equity ownership restrictions (Table 37).
(3) In the R.O.K. and Thailand, there has been increased numbers of both capital increases by existing foreign subsidiaries and M&As by foreign firms targeting local companies. A breakdown of M&A parent firm nationalities between January 1997 and June 1998 in the countries hit by currency crisis shows that U.S. and German companies have led the way. The overwhelming majority of M&As, 4,563, were initiated by U.S. companies and 2,326 were initiated by German firms, the latter being more than double the 1,110 M&As by Japanese firms (Tables 12, 13).
(4) BOP statistics for the leading economies in East Asia reveal investment trends varied between countries in 1997. FDI outflows from the R.O.K. and Singapore declined by around 4% each, whereas outflow from Taiwan rose 35.9% to US$5.2 billion. FDI by Taiwan was driven by increased investment in the U.S. and China. According to interim figures for 1998, FDI by the R.O.K. fell 26.5% during the first eight months, whereas overall FDI by Taiwan fell just 0.3% over the first half of the year. Statistics on approved investments show that while FDI by Taiwan rose 20.0% from January to July 1998, investment in the ASEAN4 fell 38.0% from a year earlier to US$120 million (Table 16). In the R.O.K., data compiled by the Korea Trade and Investment Promotion Agency (KOTRA) shows that 518 of the 4,054 foreign subsidiaries in the country withdrew, and another 724 scaled down their operations.
(5) According to statistics on approved investments, much of the FDI in Vietnam has traditionally come from the R.O.K. Over the first nine months of 1998, however, FDI inflow fell 45.5% on the same period of the previous year to US$1.55 billion. Of this, 22.7 points were due to a fall in investment from the R.O.K., showing that the economic effects of the currency crisis on the R.O.K. and others are having a ripple effect on other economies (Tables 14, 15).
Table 10. Net FDI Inflow to Indonesia
(BOP Basis)
|
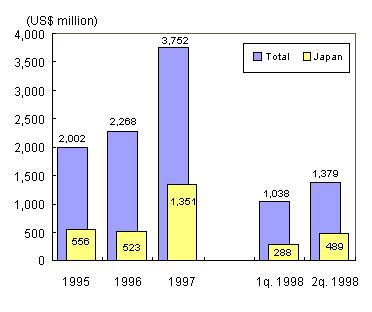
Table 11. FDI Entering Thailand
(BOP Basis) Source: Prepared by JETRO from Bank of Thailand statistics. |
|
Table 12. Trends in M&As Targeting
East Asian Companies
(Unit: US$ million)
Source: Prepared by JETRO from World
Investment Report 1998 (UNCTAD). |
|
Table 13. Nationality of Companies
in Asian M&As
(Unit: No. of M&As)
Source: Same as Table 12. |
|
Table 14. FDI Outflows from R.O.K.
(Based on Approved Investments)
(Units: US$ million, %)
Note: Percentage change on previous
year (same period).
|
|
Table 15. Trends in FDI Inflows
in Vietnam (Based on Approved Investments)
(Units: US$ million, %)
Note: Percentage change on previous
year (same period).
|
|
Table 16. FDI Outflows from Taiwan
(Based on Approved Investments)
(Units: US$ million, %)
Note: Percentage change on previous
year (same period).
|