JETRO WHITE PAPER ON FOREIGN
DIRECT INVESTMENT 1997
Japan External
Trade Organization
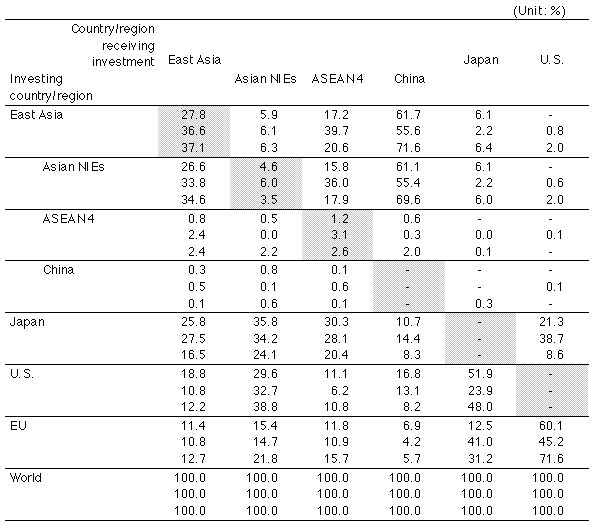
Table 11. Direct Investment Matrix (Share) (1986, 1990, 1995)

- Notes:
- Prepared from statistics of recipient
countries/regions.
- Figures for all countries/regions are, from top
row, for 1986, 1990, and 1995.
- Figures for U.S. are historical cost basis, for
Japan on fiscal year of notification (April 1 to
March 31), for the Republic of Korea on
approvals, for Taiwan on approvals, for Hong Kong
on questionnaire survey of manufacturing
industries, for Singapore on commitments in
manufacturing industries, for Thailand on BOI
approvals, for Malaysia on approvals in
manufacturing industries, for the Philippines on
BOI approvals, for Indonesia on approvals, and
for China on actual implementation.
- "EU" in principle means 15 countries.
- Source:
- Prepared by JETRO from local statistics of individual
countries/regions.
Return to the Text

