JETRO WHITE PAPER ON FOREIGN
DIRECT INVESTMENT 1997
Japan External
Trade Organization

Source: Prepared by JETRO from International Financial
Statistics, IMF.

- Notes:
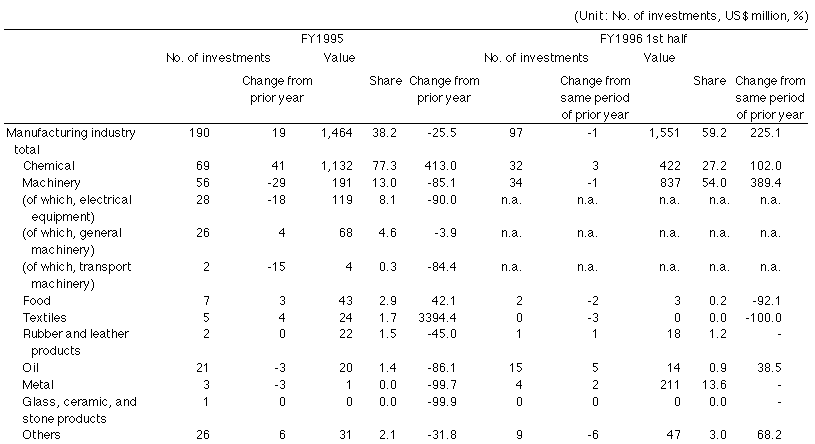
- The above statistics do not include withdrawals
(for example, the cancellation of the capital
tieup between Caltex of the U.S. and Japan Oil
etc. are not reflected in the figures).
- Shares are shares with respect to manufacturing
industry total in the case of manufacturing
sectors and shares with respect to
non-manufacturing industry total in the case of
non-manufacturing sectors. Further, shares of
manufacturing industry total and
non-manufacturing industry total are shares with
respect to total investment in Japan.
- Shares do not agree due to rounding of fractions.
- Figures for the first half of FY1996 were
announced in yen, so have been converted to U.S.
dollars by the average exchange rate during the
period (US$=Yen 108.27) of International
Financial Statistics, IMF.
- The increase in the service industry is believed
to be due to the increased investment in the
software industry.
- Source:
- Prepared by JETRO from statistics on investments notified
to Japanese Ministry of Finance.
Return to the Text
![]()
