Asia-Pacific Economic Cooperation (APEC)
The effects of the Asian crisis largely determined this last year economic outlook, although these effects varied depending on the economies. Analysing the APEC region development in 1998, as a whole, we can observe a deceleration in GDP growth, increases in unemployment levels and weakening in trade accounts.
Notwithstanding, these negative effects, signs of recovery are showing in several APEC economies. While some economies have started their recovery process before others or the speed of their recovery has been faster, it is important to state that the worst of the crisis has already passed.
The principal challenges which arise after the crisis, are the need to continue towards open trade and investment, putting aside protectionism "temptations", implement the necessary structural changes in order to count with sounder financial and economic systems, and develop and adequate social network which can help reduce the effects of this type of crisis on the population.
The analysis shows that:
This report will attempt to provide new visions, and account for the need to continue research, especially on the social and productive sector impact. These will turn out to be key elements to ensure social sustainability and competitiveness for development.
APEC Region in the World Economy 1998
|
Population |
GDP |
Per Capita |
|||||
|
(Million) |
Ratio (%) |
US$ (bn) |
Ratio (%) |
GDP US$ |
|||
|
APEC |
World |
APEC |
World |
||||
|
Western Hemisphere |
435.7 |
17.4 |
6.95 |
9675.0 |
59.2 |
33.05 |
22,205 |
|
Canada |
30.3 |
1.2 |
0.48 |
603.8 |
3.7 |
2.06 |
19,926 |
|
Chile |
14.8 |
0.6 |
0.24 |
72.9 |
0.4 |
0.25 |
4,920 |
|
Mexico |
95.8 |
3.8 |
1.53 |
424.5 |
2.6 |
1.45 |
4,431 |
|
Peru |
24.8 |
1.0 |
0.40 |
62.8 |
0.4 |
0.21 |
2,532 |
|
United States |
270.0 |
10.8 |
4.31 |
8511.0 |
52.1 |
29.08 |
31,522 |
|
Northeast Asia |
1449.6 |
57.8 |
23.15 |
5505.1 |
33.7 |
18.81 |
3,798 |
|
China |
1248.1 |
49.8 |
19.93 |
960.9 |
5.9 |
3.28 |
770 |
|
Hong Kong, China |
6.7 |
0.3 |
0.11 |
166.0 |
1.0 |
0.57 |
24,828 |
|
Japan |
126.5 |
5.1 |
2.02 |
3806.0 |
23.3 |
13.00 |
30,087 |
|
Korea |
46.4 |
1.9 |
0.74 |
310.1 |
1.9 |
1.06 |
6,683 |
|
Chinese Taipei |
21.9 |
0.9 |
0.35 |
261.6 |
1.6 |
0.89 |
11,945 |
|
Southeast Asia |
445.2 |
17.8 |
7.11 |
472.3 |
2.9 |
1.61 |
1,061 |
|
Brunei Darussalam |
0.3 |
0.0 |
0.01 |
4.9 |
0.0 |
0.02 |
15,313 |
|
Indonesia |
204.0 |
8.3 |
3.26 |
103.1 |
0.6 |
0.35 |
505 |
|
Malaysia |
22.2 |
0.9 |
0.35 |
73.3 |
0.4 |
0.25 |
3,304 |
|
Philippines |
75.2 |
3.0 |
1.20 |
65.1 |
0.4 |
0.22 |
866 |
|
Singapore |
3.8 |
0.2 |
0.06 |
84.4 |
0.5 |
0.29 |
22,205 |
|
Thailand |
61.5 |
2.5 |
0.98 |
116.9 |
0.7 |
0.40 |
1,901 |
|
Viet Nam |
78.1 |
3.1 |
1.25 |
24.6 |
0.2 |
0.08 |
315 |
|
Oceania |
27.0 |
1.1 |
0.43 |
421.9 |
2.6 |
1.44 |
15,655 |
|
Australia |
18.9 |
0.8 |
0.30 |
365.1 |
2.2 |
1.25 |
19,317 |
|
New Zealand |
3.8 |
0.2 |
0.06 |
52.7 |
0.3 |
0.18 |
13,868 |
|
Papua New Guinea |
4.3 |
0.2 |
0.07 |
0.0 |
0.0 |
0.01 |
962 |
|
Russia |
147.1 |
5.9 |
2.35 |
276.5 |
1.7 |
0.94 |
1,880 |
|
APEC |
2504.5 |
40.00 |
16350.8 |
55.86 |
6,529 |
||
|
World |
6261.3 |
29271.1 |
4,675 |
||||
Source: Data is submitted by member economies
Note: Global Nominal GDP was in the order of US$29 trillion in 1998 (FMI April
1999)
ECONOMIC TRENDS AND PROSPECTS IN THE APEC REGION
1. Recent Economic Trends in the APEC Region
Overview of the recent developments and short-term prospects
Many of the APEC member economies have been making intense efforts to adjust themselves to the new economic environment opened up by the outbreak of the Asian Crisis in 1997.
For those economies in the Northeast and Southeast Asia, which were first to be severely hit by the Crisis, the efforts are finally bearing fruit. Indicators that have been revealed in 1999 show that there are signs of a gradual reversal of the steep downtrend; the recovery is in sight. The upward trend observed in APEC economies will continue in the second half of 1999 through 2000, though the crisis continues to impact on APEC economies. The developing economies in the Western Hemisphere and Russia, which had suffered from the impacts of the Asian Crisis relatively later, are expected to see favorable changes in 2000.
For the developed economies in the Western Hemisphere, which have shown robust growth even in the aftermath of the Asian Crisis, the challenge has been to sustain the low-inflationary growth in 1999 and beyond. The success so far has contributed in securing a favorable environment for the recovery of the crisis-affected economies. Difference in the impact of the Asian Crisis led to the difference in the performance of the economies in Oceania. These economies are, however, expected to make a transition to a more sustainable growth path during 2000.
The APEC member economies as a whole is expected to show a slight pick up in the real GDP growth rate: After recording 1.9% in 1998, forecast is for a 2.1% growth in 1999, and 2.3% growth in 2000.
The overall trend in 1998 was rather somber. Almost all APEC member economies suffered a drop in their growth rates, and some even recorded negative figures. The only exceptions were the United States and Australia, whose strong and stable economies were able to withstand the successive crises that erupted in the Asian financial systems. In particular, the growth rate in the APEC region in 1998 was 1.9% i.e. 1.8 percentage points lower than in 1997, a figure that is undoubtedly one of the worst in the decade (1997: 3.7%; 1996: 4.3%).
Despite most of the Western Hemisphere economies saw sharp contractions in their real GDP growth rates, the overall Hemisphere growth rate only experienced a slight downfall from 4.1% in 1997 to 3.8% during 1998 (1996: 3.4%; 1995: 2.1%). The main reason for this slight contraction was the controlled growth rate of the United States economy whose product amounts over the 52% of global GDP for the APEC region and a 88% of the hemisphere production.
In the United States, the largest economy in the region, real GDP grew by 3.9% in 1998. In addition to performing identically as in 1997, the United States economy managed to grow uninterruptedly for the seventh year running (1996: 3.5%; 1995: 2.3%). This was followed by a 4.5% growth in the first quarter of 1999.
Canada, which had achieved a 4.0% growth rate in 1997 dropped to a 3.1% growth rate in 1998 (1996: 1.7%; 1995: 2.8%). Among the key factors prompting this drop in real GDP growth were several problems related to a decrease in consumer demand growth and a reduction in the housing construction sector, among other reasons. The economy is thus expected to grow by 2.8% in 1999 and by 2.3% in 2000.
In this Hemisphere, Latin American economies (Mexico, Chile and Peru) suffered decreased growth rates in 1998. Chile was hit by the crisis in East Asia, and its growth rate fell from 7.1% in 1997 to 3.4% in 1998. This is the lowest growth rate recorded by Chile in the 1990s. In 1999, first half are expected to record very low or outright negative growth rates, and these are expected to recover later in the year to end 1999 with a growth rate ranging from 0.5%.
Mexico grew in real terms by 4.8% in 1998, 2.2 percentage points below 1997 (1996: 5.2%; 1995: -6.2%). Insofar as projections are concerned, in late 1998 and during Q1 of 1999, the Mexican economy began to decelerate as a result of the prevailing instability of the financial markets during 1998 and the drop in international oil prices. The real annual growth rate observed in Q1 of 1999 thus amounted to 1.9%.
Peru, in turn, saw its GDP grow by 0.3%, in stark contrast with the 6.9% growth rate registered in 1997 (1996: 2.4%; 1995: 7.3%). In Q4 of 1998 the Peruvian economy was seriously affected by the East Asian crisis, which reduced capital inflows to the domestic economy.
The economies of the Northeast Asia region experienced an overall contraction of -0.8% in its GDP growth rate. This figure contrasts with growth rates observed in the past (1996: 5.8%; 1997: 3.1%).
Economic growth in Japan decelerated during 1998 and it ended up in negative figures with a rate of -2.8% (1997: 1.4%; 1996:5.1%); during fiscal year FY 1998 –1.9%. However, in fiscal year 1999, the GDP is expected to reach positive figures again, at 0.5%, a fact that is already beginning to show up in some Japanese economic indicators. This incipient recovery is seen as a reaction to the measures implemented by the government, particularly those to increase public works, stabilize the financial system and lower taxes, among others.
China whose economy represents 5.9% of the APEC region, saw its real GDP continued to grow at a relatively high speed in 1998. The growth rate reached 7.8%, one percentage point lower than that of 1997 (1996: 9.6%, 1995: 10.5%). The facts are that after the growth rate slowed down in the middle of the year due to weaker internal demand and falling exports, a huge public infrastructure investment initiative took place in China reviving the economy in the fourth quarter of 1998. In order to maintain this trend, Chinese government announced that it would continue to implement active financial policy while exploring various ways to push forwards the structural adjustment of national economy. In the first half of 1999, GDP grew at the rate of 7.6%. For 1999 as a whole, China’s real GDP is forecast to increase by about 7.0%.
Hong Kong, China and Korea also recorded negative growth figures. Hong Kong, China saw its GDP fell by -5.1% in 1998 (1997: 5.3%; 1996: 4.5%). With the economy adjusting flexibly to the adversities from within the region and beyond, GDP is expected to rebound to a growth of 0.5% in 1999. Korea is the other NIE that showed negative GDP growth in 1998; it went from a 5.0% growth rate in 1997 to -5.8% in 1998 (1996: 7.1%; 1995: 8.9%). However, in the first quarter of 1999, the Korean economy has made a slow comeback, which raises hopes that it will end 1999 with over 4.0% growth rate as a result of the upsurge that is now being felt in almost all sectors of the Korean economy.
Included among the economies recording positive growth this year, Chinese Taipei saw its real GDP growth drop from 6.8% in 1997 to 4.8% in 1998 (1996: 5.7%; 1995: 6.0%). Against this backdrop, growth projections for 1999 have been revised upwards to 5.1%.
Southeast Asian economies suffered strong decelerations in their GDP growth rates during 1998. In fact, and following the declining trend observed since 1995, the GDP growth rate for the whole Southeastern Asia region fell to -5.5% (1995: 8.1%; 1996:7.0% and 1997:4.6%). This figure finds its explanation in that all economies in this region, with no exception, experienced a contraction in their growth rates.
Table 1.5 Real GDP Growth in the Southeast Asia
|
1997 |
1998 |
Average (92-98) |
|
|
Southeast Asia |
4.6 |
-5.5 |
5.2 |
|
Brunei Darussalam |
4.0 |
1.0 |
1.7 |
|
Indonesia |
4.9 |
-13.7 |
4.2 |
|
Malaysia |
7.7 |
-6.7 |
6.3 |
|
Philippines |
5.2 |
-0.5 |
3.1 |
|
Singapore |
7.8 |
1.3 |
7.4 |
|
Thailand |
-0.4 |
-8.0 |
4.4 |
|
Viet Nam |
8.2 |
5.8 |
8.3 |
Source: Member economies
According with this, the economy that fared the worst by far was Indonesia. It suffered strongly under the aftershocks of the financial turbulence created by the crisis, and its GDP receded by -13.7% as compared to a 4.9% growth in 1997 (1996: 7.8%; 1995: 8.2%). This major drop in its GDP figures are due to decreased private investment and domestic consumption. In spite of this trend, progress achieved in the financial sector and in Indonesia’s economic performance in the second half of 1998 show that strides are already being made toward macroeconomic stabilization. In fact, the economy grew by 1.3% in Q1 of 1999 compared with Q4 of 1998.
During 1998 Malaysia underwent its first drop in GDP since 1995, ending the year with a real rate of -6.7% (1997: 7.7%; 1996: 8.6%). The Malaysian economy is now entering a recovery phase with rising domestic demand and increased public and private spending, which could spur GDP to grow by 1.0% in 1999.
In 1998 the Philippines suffered not only the effects of the Asian financial crisis, but also the havoc wreaked by the El Niño climatic fluctuations, which dragged real GDP growth down to -0.5%, a full 5.7 percentage points below 1997 figures (1996: 5.8%; 1995: 4.7%). Hard pressed, the fiscal and monetary authorities have announced several measures to reverse this trend and mitigate its effects on the population. Thus, the GDP is expected to grow between 2.6% and 3.2% in 1999, and between 4.8% and 5.4% in 2000.
Singapore also suffered a reduction in its real growth, albeit still on the positive side, plummeting from 7.8% in 1997 to 1.3% in 1998 its lowest growth figure during this decade (the lowest pre-crisis rate had been 6.2% in 1992).
During 1998, Thailand economy experienced an 8% contraction in its GDP as a result of the restructuring and adjustment of its economic and financial system. This real GDP growth rate of -8.0% confirms the tendency towards recession this economy has experienced in recent years, with rates of 8.8% for 1994, 8.6% for 1995, 5.5% in 1996 and -0.4% in 1997. During the first months of 1999 some signs of recovery have been observed that lead to expect a slight growth at the end of the period.
Viet Nam grew by 5.8% in 1998, whereas between 1991 and 1997 growth averaged approximately 8.0% (1997: 8.2%; 1996: 9.3%). This confirms the downward trend in GDP growth, which reached an annual level of 4.0% during the first quarter of 1999.
Brunei Darussalam, in 1998 registered a slow growth of real GDP of 1.0% compared to 3.5% in 1996 and 4.0% in 1997. The decline is the result of the fiscal consolidation measures adopted by the government earlier in the year and the depressed world oil prices which adversely affected petroleum sector.
The only region within the APEC which showed an increase in its GDP growth rate was Oceania, reaching growth of 4.3% during 1998 against a 3.3% in 1997 (1996: 3.5%; 1995: 4.2%). This increase was pushed-up by the Australian expansion that took place in 1998.
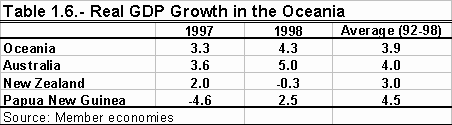
In New Zealand, 1998 ended with a negative GDP growth rate of -0.3%, i.e. 2.3 percentage points below its 1997 figures (1997: 2.0%; 1996: 3.2%). In contrast, Australia’s real GDP growth rate rose from 3.6% in 1997 to 5.0% in 1998.
Papua New Guinea, real GDP growth rate increased by 2.5% after the severe recession in1997 (1997: -4.6%; 1996: 3.9%).
On the contrary, in Russia, during 1998, the GDP fell in real terms by 5.4 percentage points, reaching a rate of -4.6% (1997: 0.8%; 1996: -3.5%). This drop in output in any case was not larger than the average growth rate for the past seven years which is a -6.7%.
Over the past year, inflation did not present an identical picture for the different APEC member economies. In 1997 most of the APEC economies recorded lower increases in CPI rates than in 1996. In 1998, however, although a large number of economies had low and relatively stable inflation rates, many others suffered from inflation rates higher than in 1997. The Asian economic crisis had impacts on the inflation rates in some economies as devaluation of their currencies caused the increase in import prices.
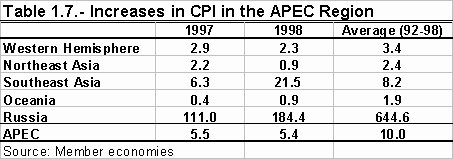
In general terms for the APEC economies, although price increase rates remained relatively low and stable, inflation on a regional scale was not as low as in 1997. The main reason is that inflation rates increased in many economies, especially in Indonesia and Russia, which reached inflation rates of 77.6% and 127.8% respectively.
General price level trends in the region can be partly explained by the fact that APEC member economies share some common elements that help keep inflation under control, while other factors create an upward pressure on the price levels. The first group includes narrow changes in the price of commodities, low prices for raw materials, the stability of most currency exchange rates vis-à-vis the dollar and the contraction of local demand, among others. On the other hand, the common factors affecting economies suffering inflationary pressures include poor climate conditions caused by El Niño and La Niña, which laid crops to waste, shrunk supply and raised prices –coupled with the price increases for other foodstuffs; these developments fueled inflationary processes that became very difficult to control.
The sharp currency devaluation in some economies in Southeast Asia at the height of financial crisis in 1998 was an added factor behind the acceleration in inflation in those economies.
Inflation in Western Hemisphere economies during 1998 was lower than the observed in 1997. CPI increase for this area reached an 2.3% against the 2.9% experienced the year before. This reduction in inflation is explained, as it has been in recent years, by the reductions in increase in CPI in the United States.
In this line, the United States once again managed to bring inflation down, yielding an overall deceleration of price increases that has remained stable throughout the 1990s with the sole exception of 1995 and 1996. In 1998 inflation reached 1.6%, i.e. 0.7 percentage points less than in 1997 (1997: 2.3%; 1996: 2.9%).
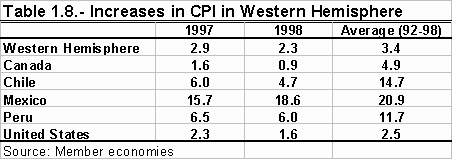
Canada, in turn, saw its CPI rise by 0.9% in 1998, the lowest rate recorded since the mid-1950s (except for 1994, when the CPI rose by 0.2% due to the cutback in tobacco taxes). Despite its low exchange rate, Canada has managed to keep inflation under control thanks to the worldwide collapse of commodity prices. In fact, the authorities decided to expand the target range for inflation by 1%-3% up to 2001, with inflation rates expected to grow by 1.1% in 1999 and 1.6% in 2000.
As was the case last year, the developing economies of Latin America kept charting different inflationary courses. Chile attained a 38-year low of 4.7% in 1998, accomplishing the target established by the Central Bank for last year. It continued on a downward inflationary slope that has been its trend since the beginning of the decade. This inflation rate, down 1.3 percentage points since 1997 (6.0%), was the result of a very tight monetary policy, among other things. Consequently, inflation is expected to total 4.3% in 1999.
In Mexico, however, inflation climbed from 15.7% in 1997 to 18.6% in 1998. Inflation is nonetheless expected to abate somewhat in 1999; in fact, inflation during the first half of the year was 4.87%, the lowest figure for this period since 1994.
Peru brought its inflation rate down from 6.5% in 1997 to 6.0% in 1998. The seasonal effects of El Niño on the price of foodstuffs during the first quarter of 1998 were neutralized towards the end of the year. For 1999, inflation should settle somewhere between 5.0% and 6.0%.
In 1998, Northeast Asia economy also showed a lower inflation rate than in 1997 (1998: 0.9%, 1997: 2.2%). Low inflation was observed both in Japan and China.
Japan has recorded low, controlled inflation throughout the 1990s. Although prices rose in 1997 compared to 1996 due to an excise tax increase, inflation rate returned to a stable trend by posting 0.2% for fiscal year 1998. Low trend of the inflation in Japan is due to the sluggish economic activities in general and the effects of deregulation. In fact, inflation for 1999 is barely expected to reach 0.1%.
In 1998, the CPI of China was down by 0.8% from 1997, with the prices of services rising by 10.1% over 1997. It is estimated that the CPI will be around zero in 1999.
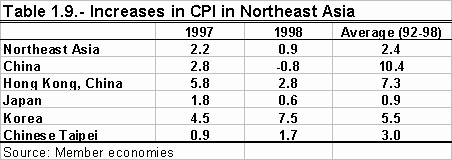
Hong Kong, China also saw its CPI descend during 1998, falling to 2.8% from 5.8% in 1997 (1996: 6.3%; 1995: 9.1%). Low inflation here is basically a reflection of the swift adjustment process of the local economy, helped by generally soft world commodity prices and low inflation in the major supplier economies. In fact, inflation has been negative so far in 1999: -1.8% in the first quarter and -4.0% in the second quarter.
Korean economy underwent a climbing price level during 1998 after a decade in the opposite direction. Inflation, which shot up to 7.5% (1997: 4.4% and 1996: 4.9%), was caused by a strong increase in prices during the first half of the year due to a devaluation. However, the massive contraction in domestic demand, declining international prices for raw materials and a stable exchange rate between the Korean won and the U.S. Dollar should once again result in consumer price stability in 1999, with inflation expected to reach 1.7%.
After posting its lowest inflation figure of recent years, Chinese Taipei saw its CPI jump from 0.9% in 1997 to 1.7% in 1998. The CPI is expected to remain subdued throughout 1999.
A major contribution to the inflation rate of the overall APEC region was made by the Southeast Asian economies, which recorded a CPI increase of 21.5% in 1998 against 5.5% in 1996 and 6.3% in 1997. This sharp increase in prices is mainly explained by high inflation observed in Indonesia, that reached 77.6 percent during 1998.
In 1998, Indonesia suffered heavily under the burden of inflation, with an annual average of 77.6%. This is in stark contrast with the picture observed throughout the 1990s, when the Indonesian economy enjoyed one-digit inflation rates with the exception of the 10.3% inflation posted in 1997. In terms of projections, inflation became negative in March and April 1999 (-0.2% and -0.7%, respectively) and therefore the final inflation figures for fiscal year 1998/99 are expected to reach 45.4%.
Table 1.10 – Increases in CPI in the Southeast Asia
|
1997 |
1998 |
Average (92-98) |
|
|
Southeast Asia |
6.3 |
21.5 |
8.2 |
|
Brunei Darussalam |
1.7 |
-0.4 |
2.5 |
|
Indonesia |
10.3 |
77.6 |
18.1 |
|
Malaysia |
2.7 |
5.3 |
3.8 |
|
Philippines |
5.9 |
9.7 |
8.1 |
|
Singapore |
2.0 |
-0.3 |
1.8 |
|
Thailand |
5.6 |
8.1 |
5.4 |
|
Viet Nam |
3.6 |
9.2 |
9.6 |
Source: Member economies
After experiencing a downward trend during the last eight years, in 1998 Malaysia registered the highest inflation rate in recent years at 5.3% (compared to 3.5% in 1996 and 2.7% in 1997). Inflationary strains nevertheless eased off in late 1998 due to falling domestic demand and lower pressures on wages following higher unemployment.
The Philippines also suffered from rising inflation in 1998, up to 9.7% from 5.9% in 1997. In the 1990s, the Philippines posted two-digit inflation (18.7%) only in 1991. All things considered, the Philippines managed to achieve its goal of containing inflation at one-digit levels for the entire period (9.7%) which, although higher than the average inflation rate for 1997, was still within the target range of 9.25% to 9.75% set by the authorities. From double-digit levels in January 1999 (11.5%), inflation rate has reverted back to single digit posting the lowest rate at 6.7% in May.
Singapore (along with China) was the only APEC economy with actual deflation during 1998. Prices there fell by 0.3% after rising from 1.4% in 1996 to 2.0% in 1997. Consumer prices have continued to decrease in 1999, with inflation at -0.6% in the first half of the year, basically as a result of lower costs in transportation, communications and housing.
In Thailand, the inflation during 1998 increased from 5.6% in 1997 to 8.1%. However, by the end of 1998 the level of prices experienced a drop, mainly due to the strengthening of the baht, a weak demand and the fall, in terms of US dollars, of import prices. This way, inflation is expected to reach a figure between the 2% and 4% for 1999.
Viet Nam, in turn, ended 1998 with inflation at 9.2%, that is, 5.6 percentage points above 1997 levels (3.6%). This economy was in the process of clamping down on inflation ever since it reached 14.4% in 1994. It succeeded in doing so in 1995, 1996 and 1997.
In Brunei Darussalam, inflation rate has been kept stable. It experienced negative inflation in 1998 with the CPI decreasing slightly by 0.4%, following the 1.7% increase in 1997.
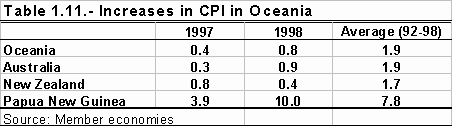
During 1998 the Oceania economy suffered a slight rise in its price level. It reached 0.8% from 0.4% observed in 1997, driven by Australia’s experience. Looking at the facts, Australian inflation was the cause of that figure.
In the past few years, despite its strong economic growth, Australia has experienced subdued inflationary pressures, with inflation rate falling from 2.6% in 1996 to 0.3% in 1997, before edging up slightly to 0.9% in 1998. Inflation in New Zealand dropped from 0.8% in 1997 to 0.4% in 1998, thus maintaining the trend of low, controlled inflation that has been observed over the past few years. This price trend is expected to keep up during 1999–through March 1999 prices have already fallen by 0.1%. In Papua New Guinea, the weakening of the kina, together with the large increase in the money supply, led to the acceleration in inflation rate to 10% in 1998.
In the case of Russia, the financial crisis fueled inflation to the extent that it hit three-digit figures in 1998, rising to 127.8% (1997: 114.9%; 1996: 147.9%). The jump into hyperinflation began in the second half of 1998 (August-September), with prices rising by 40% as a result of a sharp depreciation of the ruble that led to a steady rise in the prices for imported consumer items.
Unemployment
Despite some economies that showed sharp increases of their unemployment levels while others succeeded at controlling it, the overall unemployment for the APEC economy in 1998 was 4.6%, almost the same as in 1997.
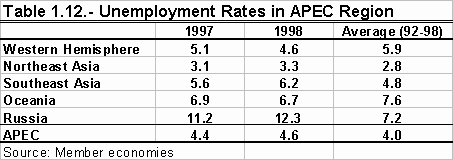
Following the trend to lower unemployment rates observed since 1992 in the Western Hemisphere region, 1998 saw a rate of 4.6% (1997: 5.1% and 1996: 5.8%), which once again was strongly influenced by the effect of the United States economic performance.
Although generally speaking the APEC member economies had to cope with a difficult year in terms of unemployment, some were able to reduce their joblessness ratio. In the United States, unemployment has continued to shrink as has been the case since 1992. In fact, the 4.5% figure attained in 1998 was the lowest since 1969 (1997: 4.9%; 1996: 5.4%). Together with stable inflation, and despite a slight increase in unit labor costs, the unemployment rate is expected to end 1999 at an even lower level than in 1998.
During 1998, Canada experienced a lower unemployment rate than in 1997. In fact, the 8.3% unemployment rate in 1998 follows the decreasing trend initiated in 1992, when the rate, that then was 11.3%, began to fall to 9.7% in 1996 and 9.2% in 1997. Nevertheless, the outlook for this year is not expected to be very cheerful as it has been so far.
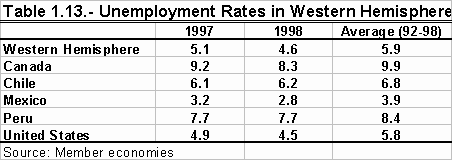
The situation in Latin America is rather disparate. In Chile, unemployment has risen due to the financial crisis and the adjustment package set in motion to counteract its effects. Unemployment in 1998 was 6.3% (6.1% in 1997 and 6.5% in 1996), climbing to 8.2% in March 1999. Mexico, in turn, was able to lower its unemployment levels to an average 2.8% in 1998, thanks to a steady increase in the active work force (particularly in commerce, agriculture and industry). In Peru, meanwhile, the unemployment rate in the Lima metropolitan area receded from 7.7% in 1997 (third quarter) to 7.7% in 1998.
Rise in unemployment rates observed in Japan and Korea during 1998. In Northeast Asia, unemployment level to increase from 3.1% in 1997 to 3.3% in 1998.
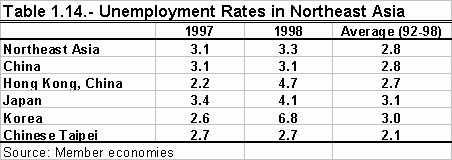
Furthermore, and continuing with the trend observed in recent years and enhanced by the contraction in the demand for labor caused by the economic downswing, unemployment in Japan reached 4.3% in FY 1998. Unemployment reached an all-time high of 4.9% in June 1999. However, a modest comeback of the economy will serve to stabilize unemployment at 4.3% in 1999.
In China, with the deepening reform of the state-owned enterprises, structural unemployment remains the problem facing the government. However, in 1998, great headway was made in the reemployment program, which enable 6.09 million laid-off staff and workers of the state-owned enterprises to find new jobs. By the end of 1998, the registered unemployment rate in the urban areas was 3.1%, which was on a par with the rate of the previous year. For 1999, the registered unemployment rate in the urban areas is estimated to be 3.5%.
Hong Kong, China saw its unemployment rate climbing steadily from 2.2% in 1997 to 5.7% in the fourth quarter of 1998, and further to 6.2% in the first quarter of 1999. But the unemployment rate fell back slightly to 6.1% in the second quarter of 1999.
In Korea unemployment reached 6.8% in 1998 (2.6% in 1997). Despite the economy having started to pick up, unemployment is expected to stay around the 6.5% mark in 1999.
In turn, and due to changes in the job structure and the financial crisis of 1997, Chinese Taipei recorded unemployment rates of 2.7% in 1998, anyway, is higher than the average rate for the period 1992-1998 that was 2.05%.
Employment prospects for the developing economies are not very encouraging. Almost all these economies have suffered adverse unemployment effects as a result of the crisis (either outright recessions or deceleration of growth). According with this, unemployment rate for the Southeast Asian economy was 6.0%, 0.4 percentage points higher than in 1997 and 0.8 percentage points higher than the rate observed in 1996 (1997: 5.6%; 1996: 5.2%).
Table 1.15 Unemployment Rates in the Southeast Asia
|
|
1997 |
1998 |
Average (1992-1998) |
|
Southeast Asia |
5.6 |
6.0 |
4.7 |
|
Brunei Darussalam |
5.0 |
5.1 |
4.6 |
|
Indonesia |
4.3 |
5.1 |
4.5 |
|
Malaysia |
2.7 |
3.9 |
3.1 |
|
Philippines |
8.7 |
10.1 |
9.4 |
|
Singapore |
1.8 |
3.2 |
2.1 |
|
Thailand |
3.5 |
4.0 |
2.9 |
|
Viet Nam |
8.5 |
6.6 |
3.0 |
Source: Member economies
In Malaysia, a contraction in the real economy brought a rise in unemployment to about 3.9% in 1998 (2.7% in 1997 and 2.5% in 1996), which is still below the full employment mark of 4%. In the Philippines unemployment rose to 10.1% in 1998, prompted by a severe recession in agriculture and industry. Employment has picked up somewhat in the first quarter of 1999, with the joblessness rate at 9.0%.
The labor market in Singapore was strongly affected since its 3.2% unemployment rate for 1998 was clearly higher than its 2.1% average in the past 7 years. This is mostly due to the steep fall in business demand and the consolidation of local business operations.
Thailand unemployment reached a rate of 4.0% during 1998, 0.5 percentage points higher than the previous year (1997: 3.5%; 1996: 2.0%). The situation is not expected to change in 1999, with a projected rate of unemployment similar to that of 1998. In Viet Nam, urban unemployment rates 6.6%.
Brunei Darussalam unemployment reached a rate of 5,1% in 1998 (1997: 5,0%; 1996: 5,0%).
During 1998, Oceania saw its unemployment level to reduce from its 6.9% level in 1997 to 6.7%. The reduction was mainly explained by the good Australian economic performance, which led its economy to reduce unemployment from 8.5% in 1997 to 8.0% in 1998.
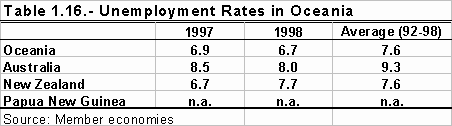
In Australia, unemployment dropped to 8.0% in 1998, the lowest since 1990 (1997: 8.5%; 1996: 8.5%). In contrast with this, New Zealand experienced a softening in the labor market due to slow growth in recent times and the economic contraction of 1998. The unemployment rate for 1998 was 7.7% (1997: 6.7%; 1996: 6.0%).
In Russia, a contraction in the real economy brought about a rise in unemployment to 12.3% in 1998 (11.2% in 1997 and 9.9% 1996).
Current Account Balances and Capital Flows
Running the largest current account deficit in the region in absolute terms, the United States is one of the economies whose deficit rose in 1998 –although it is small compared with its GDP. The U.S. current account deficit reached US$233 billion in 1998. This accounts for 2.6% of the GDP and represents an increase of 0.8 percentage points compared with the previous year (-1.8% in 1997).
This rate has climbed steadily since the first quarter of 1998, when the deficit stood at 0.6%. During the 1990s, the United States has managed to keep the deficit relatively under control in GDP terms, fluctuating between 0.9% and 1.8%, which is precisely why the 1998 figure has attracted some attention. This increase in the deficit is partly due to enhanced domestic demand resulting from a greater accumulation of capital gains. In 1998, the capital account amounted to US$237 billion of net foreign investment in the U.S. compared to the US$225 billion posted in 1997. In this regard, both U.S.-bound and U.S.-originated FDI figures are quite significant. In 1998, U.S. investments abroad totaled US$ 132 billion, whereas foreign investments in the U.S. amounted to US$196 billion (US$93 billion in 1997). Of the latter, portfolio investments were the biggest source for investments in the U.S., followed by direct investments.
In Canada, residents keep spending more than what they earn abroad, with the deficit reaching US$16.4 billion (-2.0% of GDP) in 1998 due to the shrinking trade surpluses. However, everyone agrees that the deficit should decrease in 1999 (US$15.1 billion) and then again in 2000 (US$11.9 billion).
In Latin America, the current account deficit in Chile deepened to 6.3% of the GDP. This was mostly the result of falling revenues due to the slump in the price of copper and other raw materials. The belated effect of a deceleration in the growth of exports, as well as the price drop suffered by leading export items, caused Chile to record a negative trade balance of US$ 2.5 billion. Both the current account and the trade deficits are expected to decrease in 1999. The current account deficit should be in the neighborhood of 5% of the GDP by the end of the year, whereas the trade balance deficit should shrink drastically since the drop in imports has been accompanied by rising export values. By the end of 1998, the capital account showed a surplus amounting to 4.3% of the GDP thanks to lower net flows from portfolio investments (less issues of ADRs and bonds). Finally, it should be underscored that FDI grew by 6.4% in 1998.
In 1998, the current account deficit in Mexico more than doubled the one recorded in 1997, reaching 3.8% of the GDP (US$15.9 billion). The sharp upsurge in the deficit is largely explained by the trade balance, which in 1998 recorded a US$7.7 billion deficit as against a US$623.6 billion surplus in 1997. This turn of events is largely accounted for by the falling international oil prices (hence lower oil revenues), an expansion of the domestic economy that led to increased imports of consumer and capital goods, and a steady growth in manufacturing exports that required increasing quantities of imported intermediate goods. All these factors led to a rise in the current account deficit. Fortunately, the trade balance deficit in the first quarter of 1999 seems to be going back to normal, that is, 34% lower than the one registered in the same period last year. The capital account posted a US$16.23 billion surplus in 1998, amounting to 4.0% of the GDP, whereas FDI amounted to 2.0% of the GDP.
The current account deficit in Peru rose from 5.0% in 1997 to 6.0% in 1998, principally as a result of the growing trade balance deficit. This heavier deficit is accounted for by a slack in exports intimately related to worsening terms of trade and the El Niño occurrence. Peruvian authorities estimate that the current account deficit will amount to 5.0% of the GDP in 1999. In 1998, foreign direct investments net of privatization revenues accounted for 3.0% of the GDP–the highest inflow of capital in recent years, surpassing even pre-crisis figures. Mining, telecommunications and banking have been attractive targets for foreign direct investments and are expected to remain appealing over time.
During 1998, Japan posted a current account surplus as it has throughout the decade. Its current account surplus for fiscal year 1998 amounts to ¥15.2 trillion or 3.1% of the GDP (3.2% for the calendar year), increased from ¥12.9 trillion in FY 1997. The increased surplus is due chiefly to a drastic drop in imports as a result of the sharp decline in imports price and the economic depression. Since exports are expected to fall due to slower global growth, the current account surplus is expected to decrease slightly. In turn, the capital account deficit dropped slightly in nominal term but kept almost flat as a percentage of the GDP, thereby reaffirming Japan’s role as a supplier of capital. These deficits have in fact declined slightly from ¥15.3 trillion (3.0%) in FY1997 to ¥14.7 trillion (3.0%) in FY1998.
In 1998, the current account surplus of China reached US$ 29.3 billion, accounting for approximately 3.0% of the GDP, and down slightly comparing with the US$29.7 billion (3.3% GDP) in 1997. The continuous merchandise trade surplus was the main reason for sustainable current account. However, current account surplus is forecast to decrease slightly in 1999 basically as a consequence of the slower growth of global economy and weakening export competition in global market due to appreciated Chinese currency in real term.
Departing from its strong deficit trend throughout the 1990s, Korea went from a US$6.2 billion deficit in 1997 to a US$40.05 billion surplus in 1998. This is explained by Korea’s huge international trade surplus. In 1998, exports dropped slightly by 2.8%, whereas imports plummeted 35.5%, hence the record-breaking current account surplus. Korea saw FDI rising by 21.25% for 1998, whereas in the first quarter of 1999 it has already committed 389 FDI ventures for a total US$2.0 billion.
Chinese Taipei, in turn, also has a current account surplus, although in this case figures have been steadily decreasing since 1996. The current account surplus for 1998 was 1.4% of the GDP as against 2.7% in 1997. The financial account, however, shifted course from a net capital outflow of US$8.38 billion in 1997 to a net inflow of US$1.789 billions in 1998. In FDI terms, Chinese Taipei is going to great lengths to enhance its insertion in the international investment scene; it has set out to promulgate and review its laws and regulations along international guidelines in order to draw more foreign investment to its shores. In 1998, US$0.2 billion flowed into Chinese Taipei as FDI (mostly from the British Virgin Islands, the United States and Japan), whereas another US$3.8 billion left Chinese Taipei for the same purpose. The financial account shifted from a net capital outflow position to one of net capital inflows in 1998
The developing economies in Southeast Asia have made their way from deficits to surpluses in 1998.
Indonesia also followed suit and in 1998 it obtained its first current account surplus since 1980, amounting to US$4.4 billion. In any event, this surplus is only expected to be temporary since it originated from a sharp drop in imports rather than from an increase in exports. In 1998, the capital account ended up with a US$3.7 billion deficit due to the massive flight of private capital, which largely exceeded capital inflows.
Malaysia recorded a strong current account surplus for the first time since 1989, which amounted to 13.7% of the GDP for 1998 (-5.4% in 1997). This unprecedented surplus is accounted for by the favorable impact of rapidly falling imports. In turn, the short-term capital account evidenced a net capital outflow for the second year in a row, totaling RM 21.7 million.
Although its surplus was more modest than elsewhere in the region, in 1998 the Philippines also recorded its first current account surplus of the decade, US$1.3 billion accounting for 2.0% of the GDP, as against -5.3% in 1997.
Singapore continues to register very high current account surpluses, with a credit balance of US$29.5 billion in 1998 as against US$22.3 billion in 1997, amounting to 20.07% and 15.4% of GDP respectively. The rising surplus is basically the result of an improving trade balance thanks to the drop in imports. A point worth mentioning is that the current account has already posted a S$6.9 billion surplus in the first quarter of 1999 alone. Singapore secured direct investment commitments in manufacturing amounting to S$7.8 billion in 1998 (principally from the U.S., Japan and Europe) and it has already secured S$1.7 billion in investment commitments during the first quarter of 1999.
As in the case of Malaysia, in 1998 Thailand posted its first current account surplus of the decade that reached US$14.3 billion that represent 12.3% of the GDP, against a deficit of 2.0% observed in 1997. The factors that led to this surplus were the imports, that fell much more than the exports during the year, and the net surplus in the service account and transfers owed to higher revenues for concept of tourism. Undoubtedly, this result highlights after years with fiscal deficit. Although this year it is expected to be lower, surplus will once again be attained and will be between 6% and 9% of GDP.
The current account deficit in Australia reached 4.8% of GDP in 1998, compared with 3.2% in 1997. This largely reflected a deterioration in the balance of trade, coming from continued weak net exports and weaker terms of trade. Strength in domestic demand underpinned strong growth in imports while exports growth slowed as a result of the East Asian crisis. In New Zealand, the current account deficit shrunk slightly from -7.1% in 1997 to -6.0% in 1998. This small improvement is accounted for by the decrease in the investment income deficit and a concurrent increase in the merchandise trade surplus.
In Russia current account registered a surplus of 0.9% in 1998, which is the same as 1997 and represents a decrease with respect to previous years’ surpluses (1995: 2.3%; 1996: 2.9%).
1.2 Economic Prospects for 1999
In 1999 the whole world, and particularly the APEC economies, will continue to experience the impact of the economic and financial crisis, which mainly expressed itself through a contraction or reduction of GDP growth rates in most of the member economies in 1998. Even so, a reversal in the downtrend exhibited by economic activity is anticipated for the second half of 1999, both at global and regional levels.
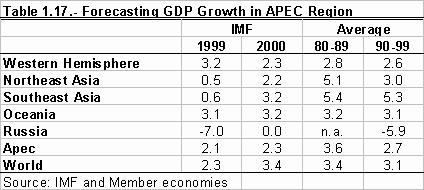
In this case, the IMF estimates that world economic growth will reach around 2.3% in 1999, and 3.4% in the year 2000. Acknowledging the impact of the crisis, most of the APEC economies have started to implement measures to boost their economic activities; such measures began to yield results in some economies during the first half of 1999 while, among the remainder of the members, a slight improvement in economic indicators is expected as of the second half of the year. All these data have been taken into account in the 1999 and 2000 projections. The upward trend observed in APEC economies will continue in the second half of 1999 and through 2000, though the crisis continues to impact on APEC economies. In fact, IMF estimates for the APEC economic growth as a whole reach around 2.1% in 1999 and 2.3% in the year 2000. Estimates for the year 2000 could have been higher, but they didn’t because of the contraction experts expect in the United States economy (1999: 3.3%; 2000: 2.2%).
This outlook is specifically reflected in the economic situation of each APEC member economy.
For the Western Hemisphere economy the IMF projects a growth rate of 3.2% for 1999 and 2.3% for the year 2000, while in 1998 it reached a 3.8% growth rate. This expected downfall in the region growth rate is due, as mentioned above, to the contraction projected for the United States economy during year 2000.
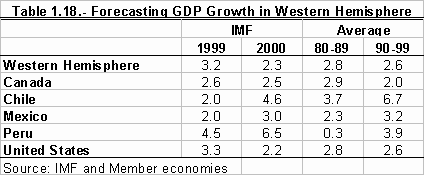
Undoubtedly, the United States and its economic performance, that accounts for the 52% of economic activity in the region, has a large influences on the overall economic trend in the APEC region. The United States is expected to maintain its good performance in terms of growth over the next years. Indeed, private agents predict a 3.8% growth for 1999, and a 2.5% growth for the year 2000, while official government predictions indicate a growth rate of around 3.9% for 1999 and 2.4% for 2000. The IMF is estimating a 3.3% growth rate for 1999 and 2.2% for 2000.
Canada, thanks to the incipient recovery of the Asian economies, to economic growth in the United States, and to a slight increase in commodity prices, will exhibit a strong and sustained growth rate, although somewhat below the 3.1% it registered in 1998. Thus, a real growth rate of 3.2% in the GDP is anticipated for 1999, and 2.6% for the year 2000. IMF projections are 2.6% for 1999 and 2.5% for the year 2000.
1999 will be a difficult year for Latin America, but with hopes of recovery for the beginning of the new millennium. Chile is currently experiencing an economic downturn going from the 10.6% growth rate recorded in 1995 to 3.4% in 1998. Chile has made efforts to correct its current account situation for the coming period, and it has continued to reduce its inflation rates; in spite of the low price of its exports, the recovery in Asia should help to increase its export volumes. Nevertheless, the Chilean economy is expected to grow between 2.0% and 3.0% in 1999, to resume its sustained growth path in the year 2000 with rates that will vary between 5.0% and 6.0%. The IMF estimates that the Chilean economy will grow at a rate of 2.0% in 1999, and 4.6% in the year 2000.
Mexico, having experienced an expansion process as of 1996 (5.2% growth rate compared to -6.2% in 1995) and which, as a result of the crisis, fell in 1998 to 4.8% (7.0% in 1997), has openly expressed its intention of reaching an average GDP annual growth rate of 5.0%, and a single-digit inflation rate. In this sense, the Mexican authorities are making significant efforts to maintain fiscal discipline and control inflation rates, expecting a downturn in the economy, with 3.0% growth in real terms in 1999, to then reach 5.0% rate in the year 2000. The IMF, on the other hand, estimates 2.0% growth for 1999, and 3.0% for 2000.
In Peru, based on export and investment performances, the authorities estimate 3.0% growth rate for 1999, and 5.5% and 6.0% for 2000 and 2001, respectively. The IMF estimates growth rates of 4.5% for 1999 and 6.5% for the year 2000.
Since 1998, Northeast Asian economies have been experiencing an important recuperation of their GDP growth rates. In fact, during 1998 the GDP growth rate for the whole area was -0.8% and the IMF projects a rate of 0.5% for 1999 and 2.2% for the year 2000.
Japan, accounting for roughly one quarter of regional economic activity, is making efforts to overcome the contraction in its GDP, which during dropped by 2.8% in 1998. These efforts translate into government-implemented measures to reactivate economic activities. An example is the thrust given to public works through supplementary budgets approved for 1998 and initial budgets approved for 1999 in an attempt to reactivate the economy. Furthermore, Japanese authorities have also implemented measures such as tax reductions and major reforms of the financial system. In this sense, changes have been made to legislation which establishes the recapitalization scheme and the general framework used to address the problems of the banking system. This has led to a rapid restructuring of this sector, contributing to the stabilization of the banking system. Legislative measures include those to recapitalize the banking system and to deal with some of the weaknesses that affect the sector through options such as temporary nationalization, bridge banks, and disposal or liquidation of banks that went bankrupt. In fact, under this scheme some banking institutions have already been nationalized and fifteen of the largest banks in the system have received injections of public funds for their recapitalization, which already amount to 7.4 trillion yen. Due to the series of efforts implemented by the authorities a real GDP growth is expected to be 0.5% for fiscal year 1999. The IMF, on the other hand, estimates a -1.4% contraction for 1999, followed by a 0.3% growth in the year 2000.
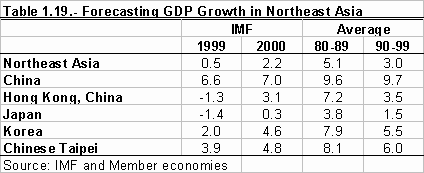
In China, stemmed by the huge investment mainly in infrastructure, the GDP registered a growth rate of 7.8% in 1998. To expand domestic demand will be a policy adopted by China to promote its economy in the coming a few years. The government projects growth rates of 7.0% for 1999 and 7.0-8.0% for year 2000-2002. The IMF estimates growth rates of 6.6% for 1999 and 7.0% for the year 2000.
Hong Kong, China, is expected to experience an economic recovery after the 5.1% contraction recorded in 1998. This recovery is expected to take place once global and regional financial markets are stable again. While overall exports of goods are expected to improve during 1999, exports of services should rebound in line with the recovery in inbound tourism. Domestic consumption is also expected to revive along with the pick up in asset prices and the gradual improvement in economic conditions. These positive developments, together with the spending by Government, should help to boost economic growth in 1999. Thus, forecasts hold that economic activity will remain relatively stagnant in the first half of 1999, to be followed by positive rates in the second half. Therefore, the real GDP growth rate for 1999 is anticipated at 0.5%; this would signify considerable progress compared to the -5.1% recorded in 1998. The IMF is less optimistic about 1999, estimating a -1.3% growth rate, and 3.1% for the year 2000.
Substantial economic growth is anticipated for Korea in 1999, based on the implementation of expansive monetary and fiscal policies seeking to help it in its economic recovery. In fact, policies already implemented have succeeded in increasing private and public spending, and therefore total expenditure is expected to increase by 4.1% this year. An important factor in this recovery, in addition to the policies implemented, is the trust that economic agents feel with regard to the world outlook. This will be reinforced this year by a the reduced inflation rate, estimated at 1.8% for 1999 and 2.0% for 2000. Thus, the Korean economy is expected to experience a full recovery in 1999, reaching a over 4.0% growth rate, and it is supposed to begin a new phase of sustained growth in 2000. IMF estimates for 1999 anticipate a growth rate of 2.0%, and of 4.6% for 2000.
For Chinese Taipei, after the two percentage-point drop in its GDP rate in 1998, GDP growth is expected to reach 5.1% rate in 1999, and an average rate ranging between 5.3% and 5.8% for the period 2000–2002. The IMF, on the other hand, anticipates growth rate of 3.9% for 1999 and 4.8% for 2000.
Southeast Asian economies, in 1999 are still suffering from the impact of the crisis, but have begun to turn around the situation so as to stop the process of economic deceleration and/or contraction. There are two common applicable factors: controlled inflation and stable currency exchange rates whether they were actually achieved in the first half of 1999 or are now implementing reforms to achieve them in the near future. If they achieve these two objectives, the economies in the region should be able to witness their recovery through enhanced domestic demand and increased exports, leading their GDP to higher growth levels.
Table 1.20 Forecasting GDP Growth in the Southeast Asia
|
Average |
||||
|
1999 |
2000 |
80-89 |
90-99 |
|
|
Southeast Asia |
0.6 |
3.2 |
5.4 |
5.3 |
|
Brunei Darussalam (*) |
0.6 |
1.5 |
n.a. |
1.2 |
|
Indonesia |
-1.1 |
3.3 |
5.3 |
4.6 |
|
Malaysia |
0.9 |
2.0 |
5.8 |
6.3 |
|
Philippines |
2.0 |
3.0 |
2.0 |
2.6 |
|
Singapore |
0.5 |
4.2 |
7.4 |
6.9 |
|
Thailand |
1.0 |
3.0 |
7.4 |
5.2 |
|
Viet Nam |
3.5 |
4.5 |
5.0 |
7.3 |
Source: IMF and member economies; (*) Asian Development Bank
As mentioned above, Southeast Asian economies will experience a slight increase in their economic activity during 1999. Although in some cases this will not be enough to show positive growth rates, it will be sufficient to significantly diminish their contraction rates. These economies are expected to show positive growth rates during the year 2000, initiating a process of full recovery toward their pre-crisis GDP rates. In fact, these economies saw a GDP growth rate of –5.3% for the whole region in 1998, while the IMF projects a rate of 0.6% in 1999 and 3.2% in year 2000.
Indonesia recorded a rate of growth of 1.3% in the first quarter of 1999, evidencing the process of macroeconomic stabilization that began in the second half of 1998, and which stands in strong contrast with the 13.7% plunge in its GDP in the same period. This improvement in economic activity has been preceded by controlled inflation, low interest rates and a stable currency exchange rate, which led to a review of projections for 1999 and 2000. Projections prepared by the Bank of Indonesia for 1999 show that the anticipated recovery of economic activity this year, although helpful, will not be enough to achieve positive growth rates, with the economy showing a contraction of between 2.0% and 1.0%. The IMF, however, estimates that the Indonesian economy will contract at a rate of -1.1% in 1999, followed by a 3.3% growth rate in 2000.
Malaysia is also entering a period of GDP recovery in 1999, fuelled by higher domestic demand and an increase in private and public spending. The Malaysian authorities anticipate 1% growth in 1999, in contrast to -6.7% registered in 1998. This is, therefore, a clear expression of economic recovery. IMF growth projections for the Malaysian economy are 0.9% and 2.0% for 1999 and 2000, respectively.
The Philippines, which in recent years experienced a slowdown in economic growth (5.8% in 1996, 5.2% in 1997 and -0.5% in 1998), has decided to give priority to recovering its economy in 1999. To this end, it has implemented three measures: re-focusing its fiscal policy that will stimulate domestic demand and fund anti-poverty programs, centering monetary policy on reducing inflation (in order to avoid pressures on its currency), and designing a reform process to allow the implementation of structural changes. Thus, in February 1999, the Philippine authorities set growth goals at between 2.6% and 3.2% for 1999, and between 4.8% and 5.4% for the year 2000. The IMF, on the other hand, estimates a growth rate of 2.0% and 3.0% for 1999 and 2000, respectively.
Singapore exhibited a positive growth rate in the first quarter of 1999, mainly thanks to the recovery of the manufacturing sector. Furthermore, and thanks to the effects caused by reduced interest rates and the improvement of expectations in the United States and Europe, in addition to the improved performance of Japan, Singapore is expected to improve slightly. Therefore, its own growth expectations should be adjusted to between 0 and 2%. IMF growth projections for Singapore are set at 0.5% in 1999, and 4.2% in 2000.
In Thailand, the progress attained in resolving economic and financial progress led the experts to project a gradual recovery of the economy with a real GDP growth rate between 0.8% and 1.3% for 1999. These experts agree that the increase in government spending, easing of monetary policy in order to encourage the real sector to recover, expansion in world growth and trade and progress in financial and debt restructuring are the main factors to explain the recovery of the Thai economy. IMF projects a growth rate of 1.0% in 1999 and 3.0% for year 2000.
Viet Nam experienced a drop in its growth rate during 1998, from 8.2% in 1997 to 5.8% in 1998 (which is still high) and, although the Vietnamese authorities have attempted to return to the 8.0% growth rate (the average achieved in recent years), they have been unsuccessful because of the low price obtained by Vietnamese export goods and scarce international demand for these products. However, they anticipate a 4.0% to 5.0% growth in 1999, and 5.0% to 6.0% in 2000. The IMF estimates that the Vietnamese economy will grow at rates of 3.5% in 1999 and 4.5% in the year 2000.
Like the Western Hemisphere economy, growth will also be slower in the Oceania economy during 1999 and the year 2000. The GDP growth rate for 1998 was 4.3% and the IMF projects a rate of 3.1% for 1999 and 3.2% during the year 2000. This slight recuperation from 1999 to 2000 is mainly because of the improved performance of the New Zealand economy.
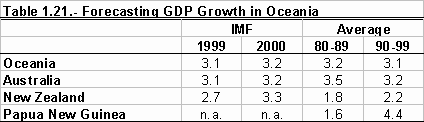
In this case, New Zealand, its economy began to overcome the contraction experienced in 1998 (-0.3% growth rate) only in the second half of that year, which leads to expectations of a sustained expansion of the GDP in 1999. Different factors will contribute to this situation: the employment rate is already growing in 1999, and the anticipated unemployment rate at year-end is expected to be 6%; inflation is supposed to drop in 1999 and should end the year within the range of 0 to 3% established by the New Zealand Reserve Bank. For all the above reasons, after the 1.3% growth exhibited in the second half of 1998, growth is expected to continue during 1999, reaching an average rate of 3.0% in the period 1999-2001. IMF annual growth estimates are placed at 2.7% for 1999, and at 3.3% for the year 2000.
The Australian economy is expected to grow solidly though at a more moderate pace than in 1998. Domestic demand is expected to remain strong in 1999, led by continuing growth in private consumption arising from strong employment growth and on-going real wages growth. IMF projections point to 3.1% growth in 1999, followed by 3.2% in 2000.
1998 Russia experienced a contraction in its product, high inflation and unemployment rates and, in few words, a generalized instability of the economy. The evident signs of reversal in market reforms, tight fiscal policy, a banking sector crisis and the deterioration of households incomes suggest that real growth rate will contract sharply in 1999. Despite the collapse of industrial production seemed to ease to the end of 1998, the general impact of the crisis on the whole economy has made the experts to worsen their outlooks for 1999. Indeed, the IMF is now projecting a 7.0% contraction in 1999, followed by a growth rate of 0% in year 2000.
As indicated in lasts paragraphs, in 1998 most of the APEC member economies experienced a year of strong economic contraction or deceleration, low export prices, and unemployment. All of the above are expressions of the contagion that spread the crisis throughout all economies in a globalized world. In this sense, it is important to note that most of the affected economies have adopted measures to reverse the situation, and have found some common solutions which, if they prove effective, could lead to the "contagion" of good results to other economies. However, some risks remain:
1. The situation in Japan. During the fiscal year 1998, Japan experienced a strong negative impact on its GDP, which contracted by 1.9%. Since Japan accounts for 23% of APEC economic activity, its economy will necessarily have an impact on the other economies that form part of APEC, either on their financial markets, exports, inflation, unemployment or other aspects. Japan has announced a series of measures to turn the situation around and it plans to implement them in 1999. These measures include an expansive fiscal policy, tax reductions, and a deep reform in the Japanese financial system. Progress has been made in recapitalizing and stabilizing the banking system, by allocating public funds to this end and, among other measures, efforts are being made to stabilize the Japanese Yen. Therefore, the government is committed to implementing these measures to ensure recovery in 1999.
2. The financial crisis in Russia. Although the Russian ruble, suffered strong pressures in 1998, it only collapsed fully in August 1998. This gave rise to a grave situation at the financial and real levels. The GDP contracted by 4.6%, inflation increased to 127.8%, and unemployment reached 12.3%. Faced with the instability of the ruble and its resulting effects, foreign lenders refused to make funds available to Russia until it accepted to implement structural reform policies in its financial system. This led to significant capital flight from emerging markets (many of them located in Asia), with severe down pressures on their currencies and the price of their assets. Therefore, it is vital for Russia to revert this situation in the course of 1999 and to stabilize its currency and domestic market, so as to ease the pressures on the rest of the markets and boost growth in the region once more.
3. Exchange rate. Most of the economies affected by the financial crisis have experienced a common problem of currency volatility, with macroeconomic effects. Some of the affected economies have apparently not yet stabilized, leading authorities in these economies to implement tough monetary policies in 1999 oriented to stabilization. Success in resuming the growth process in the affected economies will depend in part on the way in which these monetary policies are implemented and the final result obtained through these measures.
4. United States economy. For as long as the US economy remains the significant source of growth in the global economy, a sharp reversal in US economic performance–the so-called "hard landing" scenario–would have a major impact on global and regional growth projections. Although this risk has abated somewhat in recent months, there remains a possibility of a change in investor sentiment leading to a sharp fall in US equity prices with consequential effects being felt in the economy more widely. A return to healthy growth rates in Japan and Europe would ameliorate the consequences of a hard landing in the US economy, if it occurred.
5. Protectionism. A notable feature of the domestic policy responses to the recent economic crisis has been the absence of protectionist measures. As APEC Leaders and Ministers have noted on many occasions, the potential of trade and investment liberalization to contribute to economic recovery would be severely undermined by protectionist measures that restrict trade and investment flows.
6. Maintaining the momentum of structural reform. The recovery of economic performance in many of the region’s economies could ease the pressure to maintain the momentum of structural reform. Such an outcome would undermine the sustainability of recent improvement in economies’ performance, and could increase the risk that deep and prolonged economic crisis will recur.
1.3 International Financial Crisis
1.3.1 The Financial Crisis its Causes and Evolution
In recent decades, growth rates in South East Asia were among the highest in the world. The vigor of the Newly Industrialized Economies of Asia (the NIEs, that is, Korea, Chinese Taipei, Singapore and Hong Kong, China), four ASEAN economies (Thailand, Malaysia, Indonesia and the Philippines) and, more recently China and Viet Nam, made the region produce almost one third of the world's GDP in recent years. In terms of international trade, the region has also shown a significant performance and it has become one of the most important trade partners for most economies.
From 1990 to 1996, four ASEAN economies grew at an average rate of over 8.0% while maintaining high levels of domestic savings, one-digit inflation rates and low unemployment rates. This strong growth relied in part on high investment levels, which sometimes exceeded levels of domestic saving, and hence sometimes required considerable external funding. Thus, current account deficits represented–for several years–close to 8.0% of the GDP in Thailand and Malaysia.
Several factors played a role in causing the crisis, including unsustainable exchange rate regimes and risky debt management practices. A crucial observation is that weak supervisory capacity, connected lending and, at times, corrupt credit practices rendered the financial sectors of the crisis economies fragile. As a result, investment was increasingly misallocated. The gains from decades of growth had been very real, but growth rates on the eve of the crisis do not appear to have been sustainable. Some external developments may also have played a role.
In 1997, the bubble burst. Stock markets fell, and widespread losses–in some cases, outright defaults–appeared, revealing the low profitability of past investments projects. Non-performing loans, already rising before the currency crisis, escalated, threatening many financial institutions with bankruptcy. In addition, the firms, banks, and investors that had relied heavily on external borrowing were left with a large stock of short-term, foreign currency-denominated, unhedged foreign debt that could not be easily repaid. The exchange rate crisis that followed made the problem worse: the real burden of debt denominated in foreign currencies rose sharply as the currencies depreciated, thereby leading to further financial crisis for banks and firms. The free fall of currencies was intensified by the sudden rush of firms, banks and investors to cover their previously unhedged liabilities in foreign currency. In turn, this accelerated depreciation aggravated the original foreign currency debt problem creating a vicious circle.
A detailed chronology of the Asian crisis is provided in Annex 1 and 1998 APEC Economic Outlook. The recovery of most of the affected economies has been remarkable.
As of June 1999, the financial crisis that began in East Asia in mid-1997 had apparently begun to recede. Continued economic recovery appeared to depend in large part on initiatives to introduce and implement reforms particularly in banking. The recovery of the financial sector in the most affected regions needs to be underlined, as well as the fact that signs of improvement and stability are evident in al economies. In this sense, the IMF issued a warning stating that signs of improvement in some Asian economies should not make those nations hold off on reforming their financial systems, which are necessary to strengthen banks and adjust their corporate debt, because this could open up the possibility for new economic crises. The IMF further stated that it intended to call on investors to do the same.
The following has been observed in many APEC economies:
1.3.2 The Causes of the Asian Crisis
Studies of the Asian crisis suggest that while no single factor by itself can explain the collapse, a range of factors interacted to generate the crisis. This range encompasses factors that were sources of increased vulnerability (such as weakness in financial structure) and those that were more proximate causes, that is, events or news that lead economic agents to reassess their positions (such as a devaluation in a country that adversely affects the international competitiveness of other economies).
Most explanations for the Asian crisis emphasize the fundamental weaknesses of the major affected economies, particularly unsustainable exchange rate regimes, inappropriate reliance on short-term capital, and financial sector weaknesses. In addition, some explanations emphasize the role of volatile international financial flows, which can be destabilizing.
In spite of high saving rates, the investment boom in the East Asian region led to large and growing current account deficits financed primarily through the accumulation of short-term, foreign currency-denominated and unhedged liabilities by the banking system. Exchange rate regimes entailing fixed but adjustable pegs to the dollar exacerbated the problem in two ways. First, they led to real currency appreciation’s (as a result of the 1995-98 appreciation of the dollar) that worsened current account deficits. Second, the promise of fixed exchange rates led borrowers to discount the possibility of future devaluation, and thereby led them to underestimate the cost of foreign capital. At the center of each crisis was this kind of regime. Also, while budget deficits were apparently low, the implicit and explicit government guarantees of a bailout of the financial system in a crisis implied large and growing unfounded public liabilities that emerged once the currency crisis triggered a wider banking crisis.
Concern among investors about the commitment of governments to structural reforms intensified policy uncertainty, contributing to widespread capital outflows. Although fundamentals likely triggered the crisis, currency and stock markets may also have overreacted, with panic, herd behavior and a generalized increase in risk aversion producing a sudden reversal of capital flows, exacerbating the crisis.
Financial sectors of the crisis economies were prone to fragility due to the prevalence of corrupt credit practices with loans often politically directed to favored firms and sectors. In addition, regulation and supervision of crisis country banking systems were notably weak. Moreover, moral hazard derived from implicit or explicit government bailout guarantees of financial institutions.
Such financial sector weaknesses contributed to a lending boom and over-investment in projects and sectors that often were risky and of low profitability, such as real estate and other non-traded sectors; excessive capacity accumulated in some traded goods sectors. Prior to the crisis, speculative purchases of assets in fixed supply fed an asset price bubble, with equity and real estate prices rising beyond levels warranted by fundamentals.
Domestic and international capital liberalization unaccompanied by appropriate regulation and supervision may have aggravated the original distortions by allowing banks and firms to borrow more and at lower rates in international capital markets.
Empirical studies confirm that the return to capital fell sharply in the East Asia region as the result of excessive investment. Studies document a rapid build-up of fixed assets throughout Asia between 1992 and 1996 with particularly rapid growth in Indonesia and Thailand. With most of the growth financed with debt, high levels of corporate leverage were already prevalent in 1996, well before the currency crisis increased the burden of foreign debt. At the same time, moderate to low profitability severely impaired the ability of many Asian firms to meet their interest payment obligations.
The sharp reversal of capital flows to the East Asian region in the second half of 1997 is clearly evident in the data. Net private flows to five Asian crisis economies (Thailand, Korea, Indonesia, Malaysia and the Philippines), which averaged $89 billion per year in 1995-96, reversed dramatically in 1997, which saw a net outflow of $6 billion. This sharp reversal, amounting to more than 10 percent of the GDP of the five crisis economies, occurred in the second half of 1997 as foreign investors fled and international banks sharply contracted their short term loans. Commercial banks accounted for three-quarters of this reversal, withdrawing $29 billion in 1997. While equity investments also fell in 1997, the decisions by international commercial banks not to roll over their loans to Korea, Thailand and Indonesia severely exacerbated the financial crisis and the currency collapse. In 1998, it is estimated that net private outflows were even larger than in 1997, about $25 billion, driven again by large-scale bank withdrawals.
The drastic reversal of capital flows necessitated a severe adjustment of the current accounts of the affected economies. Current account deficits can only be sustained as long as foreign lending is available to finance them. The withdrawal of needed financing therefore resulted in higher domestic interest rates, depreciated currencies, and sharp economic contraction, producing a substantial decline in imports and large current account swings in the crisis economies. The aggregate current account balance of the five crisis economies moved from a deficit of $54 billion in 1996 to a deficit of $25 billion in 1997 (with most of the adjustment in the second half of the year) and an estimated surplus of $66 billion in 1998. As private capital flows have fallen sharply, the role of financing external obligations has been transferred to the official sector (IMF, multilateral and bilateral official creditors) and to foreign reserves: while in 1996 the Asian five made small net transfers to official creditors, they received net official flows of $31 billion and $28 billion in 1997 and 1998 respectively. Moreover, while in 1995 and 1996, net private inflows in excess of current account imbalances led to sharp increases in foreign exchange reserves, the turnaround of capital flows in 1997 led to a loss of foreign exchange reserves equaling $31 billion.
While the reversal of capital flows in 1997 was partly explained by the fundamentals and policies followed by the crisis economies, its size and concentration in the second half of 1997 suggest that, in addition to the debtors’ excessive reliance on short-term bank debt, investor flight, especially by commercial banks, could have made the crisis worse. The calls for greater private sector involvement in crisis resolution (as in the G-7 report on financial architecture from June 1999) recognize that the private sector needs to be involved in preventing financial crises and, if they do occur, needs to contribute constructively to their containment and orderly resolution.
1.3.3 Effects of the Crisis on the World Economy
The following are some of the main consequences of the international crisis on the world economy:
1.4 The policy response to the crisis in international cooperation
1.4.1 IMF Policies during the Crisis
IMF has been playing a central role in assisting the crisis-affected economies by providing them with financial and technical assistance.
At the onset of this current turbulent period, the goal of the IMF was to reestablish trust in the three most severely affected Asian economies, namely, Indonesia, Korea and Thailand. The method implemented involved a combination of financial support and economic policy requirements, which had two main components:
(a) IMF Supported Measures in the Asian Economies
Monetary policy
Monetary policy in the IMF programs is designed to balance two objectives: namely to avoid a depreciation-inflation spiral and to maintain the macroeconomic stability. In Korea and Thailand, monetary policy was eventually tightened to prevent the large initial currency depreciations from initiating depreciation – inflation spirals. In contrast to these economies, monetary policy in Indonesia was not too tight. On the contrary, the authorities lost control of money and credit, and nominal interest rates and exchange rate were driven by market risk premia while underlying real interest rates remained negative.
A frequently asked question on the monetary policy in the IMF programs is whether its program’s successful stabilization in Thailand and Korea caused monetary condition too tight, contributing excessively to the contraction in economic activity. Some argue that this measure is inefficient because lack of trust is reflected in the high-risk premium demanded by investors. This caused problems for local banks and companies, which were unable to meet their financial commitments.
However, the fact that the currencies of Korea and Thailand recovered by mid-1998 as interest rates declined to pre-crisis levels suggests that economic stability is being restored with the implementation of IMF programs. Furthermore, the IMF itself has reviewed its measures in the crisis-affected Asian economies. It examined evidence on various monetary indicators and concluded that monetary tightening in Thailand and Korea was not extreme in relation to other crisis elsewhere. As IMF itself admitted, this is not to deny that monetary tightening had a cost for real economy. But it should be noted that the alternative would almost certainly have been more costly.
Fiscal policy
In the fiscal policy front, the initial IMF programs included fiscal adjustment measures to offset a weakening of fiscal positions with the aim of supporting external adjustment without an excessive squeeze on the private sector’s financing, and to make room for the costs of bank restructuring and social safety nets.
Some criticize the recessive effects that this policy generates in economies that are undergoing a crisis. Also some argue that restructuring the banks gives rise to a long-term commitment and therefore it is perhaps unnecessary to demand immediate fiscal surpluses.
If these deficit targets had been implemented under the macroeconomic conditions that emerged, they would have implied an excessively contractionary policy. However, beginning early in 1998, as the recession deepened and current accounts shifted into large surpluses owing to sagging domestic demand and large currency depreciation’s, fiscal policy became increasingly oriented toward supporting economic activity. The Fund relaxed its fiscal targets, allowing deficits in all three economies to increase considerably in order to accommodate part of the effects of the automatic stabilizers and the exchange rate depreciation on the fiscal positions.
Structural policy
Since financial sector vulnerabilities had played a major role in causing the crisis, financial sector restructuring stood at the top of the structural reform agenda and formed the centerpiece of the IMF supported programs. Under this program, institutions that were evidently insolvent were cleaned up or close down, and other institutions were also examined comprehensively to assess and, if necessary, strengthen their balance sheets.
Although no one questions the fact that several banks in Indonesia, Korea and Thailand required some form of intervention, there is question whether the abruptness with which this process was carried out made the problem worse and encouraged a run on the banks that ended up by affecting even solvent banks.
IMF argues that, as a vicious circle of growing problems in the financial sector and worsening macroeconomic environment had rapidly evolved, there was no alternative to the reactive approach that characterized its measures. It also points out that failure to begin to address the weakness of financial institutions early on would have implied a continuing rapid deterioration of financial sector conditions with attendant macroeconomic consequences.
(b) IMF Intervention and Moral Hazard
An additional concern is whether the assistance packages provided by the IMF could involve an increased moral hazard by encouraging the disappearance of incentives for monitoring by investors. Similarly, it could induce businesses to take more risk they can rely on the eventual bailout through the IMF.
However, the IMF and some economists have responded by pointing out that such arguments are not valid. Private investors have had to bear significant losses in their positions in Asia and other emerging markets and banks, despite IMF warranties, have suffered important losses in their loan portfolios. Moreover, the rigidity of IMF assistance programs translates into an important political cost for those who made the decisions that led to the crisis.
Furthermore, it is necessary to compare the cost of the distortions generated by the moral hazard stemming from the IMF intervention with the alternative of allowing economies and their creditors to freely negotiate the debts. This is an option that could have even more serious consequences for the economy. Likewise, in the highly integrated global economy, the risk of contagion increases when the IMF fails to intervene. Therefore, an institution capable of acting quickly in a crisis is needed, so as to prevent the crisis from spreading and involving the International Financial System. Under the current circumstances and in the absence of extensive reform of the international finance system, the IMF is still the organization that is best qualified to do so.
1.4.2 International Financial Rescue Packages
In response to the severity of the South East Asian crisis, international finance organizations and some developed economies granted unprecedented assistance packages to try to contain the crisis in Asia.
The IMF has guided and managed the international response to the financial crisis. Furthermore, it has coordinated its work with other international finance organizations to provide economic resources to the economies more heavily affected by the crisis. It approved financial assistance to support reform programs in Korea, Indonesia and Thailand. It helped the most seriously stricken economies to organize economic reform programs to address the structural problems made evident by the crisis. The World Bank also allocated a large amount of resources to the economies affected by the financial crisis in support of the IMF-led effort. The World Bank adopted multiple strategies, including support for structural reforms to reestablish high growth levels, economic assistance to low income economies during the crisis and it is working to reestablish the international flow of capital.
Table 1.23.- International Assistance (in US$ billions)
|
|
IMF |
World Bank and Asian Development Bank |
Bilateral Assistance |
Total |
|
Korea |
16.1 |
8.0 |
23.2 |
47.4 |
|
Indonesia |
12.3 |
10.1 |
20. |
42.4 |
|
Thailand |
3.9 |
2.7 |
10.5 |
17.1 |
|
Total |
32.3 |
20.8 |
53.7 |
106.9 |
Source: International Monetary Fund
The Asian Development Bank acted in close coordination with its member economies, the IMF and the World Bank to develop policies designed to overcome the crisis. These efforts culminated in loans and support for several of the economies affected by the crisis.
1.4.3 APEC’s Response to the Crisis
The Asian financial and economic crisis has been a central concern for the APEC community since its onset. The crisis calls for the close collaboration and participation of the industrialized economies and emerging market economies to restore the economic stability in the APEC region. APEC has played a major role in this regard notably in promoting cooperation between developed and developing economies in responding to the crisis. Leaders noted in Vancouver that, as the region’s most comprehensive economic forum, APEC is particularly well suited to play a pivotal role in fostering the kind of dialogue and cooperation on a range of policies and develop initiatives to support and supplement the efforts made by various fora in the international community. APEC’s response to the crisis is examined in the following section.
Role of APEC in responding to the crisis
International financial institutions such as IMF, World Bank and Asian Development Bank and the governments of industrialized economies played, and continue to play, a major role in providing short-term financial assistance and technical assistance to crisis-affected economies. APEC Leaders recognize the central role of the international financial institutions and are "resolved to work together to address shared challenges" presented by the crisis.
APEC has played a unique role in assisting the economic recovery in the region utilizing its unique membership and approach:
Types of APEC response to the crisis
There are many types of initiatives which address the difficulties arising from the crisis and support the economic recovery in affected economies in the region. The following are examples.
The APEC Leaders Meeting provides a unique and valuable opportunity for to the APEC community to discuss the various issues related to the crisis at the highest level of the governments.
Financial instability and recession might easily have sparked pressure for increased protectionism, but APEC’s collective commitment to open markets has helped forestall any such response. At the their meetings in Vancouver and Kuala Lumpur, Leaders, noting that open markets bring significant benefits, reiterated the need for liberal and open markets and an enabling environment for investment. They also reaffirmed that APEC will continue to pursue trade and investment liberalization to foster further growth.
At the Ministerial meeting in Kuala Lumpur, Ministers reaffirmed their commitment to achieve APEC’s trade and investment liberalization goals through the process of individual and collective actions. Ministers viewed trade and investment liberalization as an important element in restoring confidence in the region and in stimulating economic growth.
Strengthening markets, a central theme of New Zealand’s 1999 APEC chairmanship, is directly related to efforts to prevent a recurrence of the financial crisis. A key element is the effort by economies to develop a set of principles for competition policy and regulatory reform. Another important element is to strengthen financial markets in the region.
Under the Finance Ministers process, various collaborative initiatives have been undertaken to strengthen regional financial markets. These initiatives include:
(a) strengthening financial market supervision;
(b) promoting pension reform;
(c) improving credit rating agencies and disclosure;
(d) promoting the development of deep, liquid and mature domestic bond markets;
(e) strengthening corporate governance;
(f) continuing work to design a Voluntary Action Plan for Supporting the Freer and Stable Capital Flows;
(g) establishing a privatization forum; and,
(h) considering further the issue of appropriate exchange rate arrangements.
A notable example in this area, was APEC contribution to setting up the "Manila Framework" for enhancing regional cooperation to promote financial stability. Finance and Central Bank Deputies from 14 Asia-Pacific economies in the region met in Manila in November of 1997, three months after the outbreak of the crisis and agreed on the framework, which includes the following initiatives: (a) a mechanism for regional surveillance to complement global surveillance by IMF; (b) enhanced economic and technical cooperation particularly in strengthening domestic financial systems and regulatory capacity; (c) measures to strengthen the IMF's capacity to respond to financial crises; and (d) a cooperative financing arrangement that would supplement IMF resources. Successive meetings are held periodically to check the progress in its initiatives and review the economic situation in the region.
APEC Finance Deputies will report to APEC Leaders in September 1999 on issues relating to the reform of the international financial system. This report will form the basis of any APEC contribution to the discussion on reforming the international financial system.
A number of APEC fora, in addition to APEC Finance Ministers, have reviewed the crisis and its effects.
Bibliography
Asian Development Bank, Asian Development Outlook 1999.
APEC, APEC Leaders’ Statement, November 1998
APEC, Sixth APEC Finance Ministers Meeting.
APEC, 1998 Economic Outlook, November 1998
IMF (1999), IMF Supported Programs in Indonesia, Korea and Thailand; A Preliminary Assessment, T. Lane, et al., IMF, 1999.
IMF, World Economic Outlook, IMF, May 1998
OECD, OECD Economic Outlook, OECD, June 1998.
World Bank, East Asia: The Road to Recovery, 1998.
Landmarks of the Asian crisis
Highlights of the Asian Crises
1997
July 2 Faced with a grave financial crisis, the Central Bank of Thailand announced that it would implement a "dirty float" system for the baht, which was immediately devalued by 18%. This was the real trigger for the Asian crisis.
July 11 The Central Bank of the Philippines broadened the flotation range for the peso after the currency fell by 6.4%.
July 11 The Bank of Indonesia widened the exchange rate intervention band from 8% to 12%.
July 24 The Malaysian ringgit hit a 38-month low vis-à-vis the dollar.
August 8 The Malaysian government announced that it would no longer defend the ringgit.
August 11 The international community, through the International Monetary Fund (IMF), went to Thailand’s rescue and granted a US$17.2 billion loan. This offer is the heaviest financial bailout package since 1995, when the IMF lent Mexico US$ 40 billion.
August 11 News that Malaysia would assist Thailand with US$1 billion prompted a run on the local currency (ringgit), which fell to its lowest value in the past 41 months.
August 12 The Singapore dollar dropped by 1.5%, to its lowest level in three years.
August 14 The bank of Indonesia decide to abandon the managed floating exchange rate system and adopted the free-floating system through removing exchange rate intervention band.
August 19 The c) maintained its lending rate at 5.5%.
September 3 In today’s events, the Central Bank of Thailand had to step into the market when the local currency hit a new all-time low at 37 bahts to the dollar. The baht rose slightly thereafter and ended the trading session at 36 bahts to the dollar, down 4.5% compared to the previous day.
September 3 The Philippine peso dropped amid rumors that monetary controls could be relaxed by the Monetary Board, falling by 3%.
September 16 Indonesia announced that it would postpone projects intended to shrink the public deficit.
October 8 Indonesia has placed itself voluntarily under IMF tutelage.
October 8 So far in 1997, the Indonesian rupiah has suffered the sharpest depreciation (56%), followed by the Thai baht (40%), the Philippine peso (33%), the Malaysian ringgit (28%) and the Singapore dollar, which fell to a 42-month ow and accumulated a 11.6% devaluation against the dollar.
October 14 The Vietnamese dong has been depreciated by 5% after the State Bank of Viet Nam decided to broaden the dollar’s fluctuation margin from 5% to 10%. This allowed the dong to be traded at 12,293 units per dollar, i.e. a de facto devaluation of 5%.
October 14 Thailand agreed to a US$2.8 billion budget cutback in its struggle to meet the requirements agreed to with the International Monetary Fund (IMF). The country must achieve a budget surplus amounting to 1% of the GDP.
October 21 Massive resignation of the 48-member Thai Cabinet.
October 21 The Asian Development Bank drastically lowered its growth projections for Thailand from 6.1% to 1.9%, a clear reflection of the grim economic outlook for the region.
October 23 The Hang Seng index–leading indicator for the Hong Kong, China stock exchange–recorded its deepest plunge in ten years (10.4%) and accumulated a 23% drop this week.
October 27 The Mexican peso surpassed the mark of Mx$8/US$1, scoring the biggest drop among the emerging currencies (6.5%). Therefore, the Central Bank of Mexico sold US$200 million to hold back its currency. The Mexican Stock Exchange slid back 13.34% to 4,263.89 points, its lowest level since 18 June of this year, dragged down by the overall restlessness in the world markets. This was the biggest drop in percentage terms since 20 October 1987, when the stock market lost 13.43% amid a crisis in the international financial markets.
October 27 The Lima (Peru) Stock Exchange crumbled along with the other regional stock markets, in its sharpest fall since the Mexican "Tequila" effect. The general index dropped 6.44% to 1,826.77 points, whereas the blue-chip index plummeted 7.31% to 2,691.64 points.
October 31 A US$23 billion bailout package led by the IMF, with the participation of the Asian Development Bank, the World Bank and several economies, was announced to Indonesia.
November 5 The Korean stock exchange fell by 10%, pushed down by soaring interest rates and panic-stricken brokers.
November 7 Asian securities nosedive as a result of the recent Korean stock market crash.
November 20 Amid general uncertainty over whether Korea will receive an IMF loan or not, the Malaysian stock market fell 13% and the Korean won dropped 2.9%.
November 25 The yen fell to a 5-year low against the dollar.
November 27 The IMF agreed to extend a US$ 3.9 billion credit facility to Thailand over the next 34 months.
December 9 The IMF is considering financial aid for Russia.
December 15 Korea eliminated the dollar exchange rate band.
December 19 The Asian Development Bank announced emergency aid packages for Indonesia and Korea, totaling US$3.5 billion and US$4 billion respectively.
December 24 The IMF, together with the United States and 12 other economies, agreed to provide Korea with a US$10 billion bailout package to alleviate its beleaguered economy. The Indonesian rupiah fell to a new all-time low after breaking news that the country’s short-term debt was much larger than originally estimated.
December 29 The Korean Parliament passed economic reforms, among which the creation of a regulatory entity for banking and finance stands out.
December 31 The Indonesian Finance Ministry announced several reforms to consolidate and/or merge seven existing banks into three banking institutions by July 1998.
1998
January 2 Leading US and European banks announced additional grace periods for Korean borrowers to repay an estimated US$15 billion in short-term loans that had matured last 31 December.
January 5 Thailand announced that it would ask the IMF to ease the terms of its US$17 billion package since its currency, the baht, had fallen to less than half its mid-1997 value. Prime Minister Chuan Leekpai said that Thailand would try to soften IMF demands to generate a budget surplus in 1998.
January 7 Asian currencies plummet to new all-time lows. The Indonesian rupiah, the Philippine peso and the Malaysian ringgit dropped by 12.8%, 9.8% and 7.2%, respectively.
January 12 One of the largest independent involvement banks in Hong Kong, China, namely Peregrines Investments Holdings, was being liquidated.
January 16 International lenders have finally drawn up a plan to defer Korea’s short-term debt until 31 March.
January 16 In Indonesia, President Suharto reached an agreement with the IMF to restate its budget and announced additional economic reforms, including the dismantling of key monopolies and the closing of banks overburdened by debt.
January 27 Indonesia requested a temporary freeze on the repayment of corporate debt.
January 29 The Korean government and a group of 13 international banks agreed on a plan to extend the maturity of approximately US$24 billion in short-term loans to the Korean system from one to three years.
February 3 The renewed confidence of foreign investors helped the Asian stock market to recover ground, led by a 23% increase in the Malaysian stock exchange.
February 6 Thailand announced the absorption of three financial institutions.
February 16 The Indonesian rupiah suffered a 21.3% depreciation amid civil unrest fired by the spiraling prices of staple goods.
February 18 It was announced that unemployment in Indonesia amounts to 14.7% of the total population.
February 23 The region’s stock markets crumbled after the G-7 Finance Ministers failed to offer any solution to the Asian crisis at their recent meeting in London.
March 5 The Indonesian rupiah fell 14% amid rumors that the IMF may suspend the disbursement of US$3 billion scheduled for 12 March.
March 25 The Asian markets rose slightly as they have throughout the month of March.
April 24 Japan announced its largest fiscal encouragement package in history, to support projects amounting to slightly over 3% of its GDP.
May 8 The rupiah fell by 10.8% amid fears of a social explosion in Indonesia.
May 19 The Indonesian rupiah dropped 16% due to erupting violence.
May 26 The Korean stock index fell 6.5% amid rumors of an impending recession, union unrest.
May 26 President Yeltsin signed an austerity package to stabilize the budget and reduce spending. The Finance Minister announced spending cutbacks of US$10 billion.
June 8 The Japanese yen dropped by fears of an economic recession in Japan.
June 12 Japan is now in recession after two quarters of negative growth.
June 16 Korean stock exchange reaches an 11-year low. The Asian markets sagged as a result of fears of a possible devaluation of the Chinese RMB.
June 18 Korea announced that it would liquidate 55 insolvent companies under an IMF agreement.
June 18 The IMF postponed the delivery of a new US$670 million tranche of a US$9.2 billion loan to Russia, arguing that problems persist in the implementation of reforms, particularly in the fiscal realm.
June 19 Russia applied to the IMF and other lenders for another aid package amounting to between US$10 to US$15 billion.
June 22 In an unprecedented move, the Chinese government ordered the closedown of the Hainan Development Bank for having defaulted on its debts.
June 23 President Yeltsin introduced a plan to fight the crisis, which includes budget cuts and radical changes to the taxation systems.
June 25 The IMF approved the delivery of a US$670 million tranche under a US$9.2 billion loan to Russia, in spite of which Russian stock prices fell once again.
July 13 Hard hit by the Asian crisis, and further aggravated by its own internal structural weaknesses, Russia secured an unprecedented US$22.6 billion in financial aid for 1998 and 1999, on the condition that it reduce its budget deficit by half.
July 16 The IMF announced US$ 6 billion in fresh aid funds for Indonesia.
July 19 President Yeltsin approved by decree some of the initiatives under the anti-crisis plan rejected by the Duma, such as the proposals to increase tax collections.
August 11 Speculations of a potential depreciation of the Chinese currency plunged the Asian stock markets to all-time lows.
August 12 The Russian Central Bank curtailed banking activities, particularly currency transactions, to defend the ruble.
August 14 President Yeltsin insisted that the ruble will not be depreciated and urged the Duma to hold a special session to review the anti-crisis plan.
August 17 The Russian government carried out a de facto devaluation of the ruble.
August 18 The Moscow stock exchange lost 9% and the ruble fell by 7%.
August 27 "Black Thursday", the Latin American financial markets fell sharply: In Argentina stocks dropped 10.6% and in Brazil, 10%. The Russian stock market reached an all-time low and the ruble has lost roughly 50% of its value since 17 August. Malaysia and Korea announced that their Gross Domestic Product had fallen for the second quarter running, thereby joining other economies or regions now officially in recession, such as Japan, Thailand, Indonesia and Hong Kong, China.
September 1 Malaysia introduced selective exchange controls to insulate the economy from further deterioration and to regain monetary independence.
September 8 Brazil announced US$3.4 billion in budget cuts for this year.
September 9 Bank of Japan lowered its key interest rate to 0.25%.
September 28 Fourteen banks and securities corporations, coordinated by the Federal Reserve of New York, structured a US$3.625 billion bailout for arbitrage fund Long Term Capital Management.
September 29 Federal Reserve lowered its interest rate by a quarter of a percentage point to 5.25%.
October 15 In a surprise move, the US Federal Reserve lowered the interest rate to 5%.
October 28 Brazil announced a plan that includes spending cutbacks and tax hikes amounting to US$84 billion.
November 10 ECLAC estimated that Latin America would grow by almost 2.6% in 1998.
November 13 Brazil, the world’s eighth largest economy, announced a fiscal adjustment plan. Newly elected President Cardoso delivered a letter of intent to the IMF, to apply for a financial aid program to offset the US$30 billion drop in Brazilian reserves.
November 16 An encouragement package for the Japanese economy was announced for a record-breaking sum of US$196 billion.
November 16 The United States and Japan announced a US$10 billion aid plan for Asia.
November 17 The United States Federal Reserve cut its interest rate to 4.74%.
November 23 The Dow Jones closed at an all-time high of 9,374.7 points.
December 3 Concerted interest rate drops in the Euro region. Austria, Belgium, Finland, France, Germany, Ireland, Luxembourg, the Netherlands, Portugal and Spain aligned their rates at 3%.
December 21 Japan announced a 5.3% increase in spending to fight the recession.
December 24 The Duma passed the draft Russian budget for 1999 in the first of four voting sessions.
1999
January 6 Governor of Minas Gerais and former president Itamar Franco, an opponent of Cardoso, decreed a moratorium on his State’s US$12.7 billion debt with the Brazilian Treasury. A political crisis was unleashed and fear is rampant that the powerful states of Rio de Janeiro and Rio Grande do Sul will follow suit.
January 6 Thailand is considering the possibility of privatizing telecommunications, energy and transportation, sectors considered of key significance for the country. This is a new government strategy.
January 10 Unemployment in the United States reached 4.3% in December, a 28-year low, according to figures provided on Friday by the Labor Department.
January 13 The Chairman of the Central Bank of Brazil, Gustavo Franco, announced his resignation "on personal and professional grounds". Successor Francisco Lopes disclosed the establishment of a broader dollar exchange band. The US currency immediately rose to the top of the band, which established limits of 1.20 and 1.32 reals. Currency flight was calculated at US$1.1 billion.
January 14 The Central Bank of Brazil stepped in to maintain its currency within the established limits. Currency flight is now at US$1.8 billion.
January 14 After Gitic, China’s second largest intermediation company officially requested to be declared bankrupt, the Government warned the international banking system not to lend funds to Chinese financial institutions without first securing official authorization.
January 14 This Thursday, financial rating agency Standard and Poor’s lowered its rating for Brazil’s US$58.1 billion long-term dollar debt to B+, and for its US$250 billion local currency debt to BB-. This drop in rating is due to the high cost of loans since debt issues are affected by a higher interest rate.
January 15 The Central Bank of Brazil revoked the limits to the currency exchange band, allowing a clear float for the dollar.
January 21 The Brazilian currency depreciated once again despite Wednesday’s legislative victory. The dollar closed at 1.72 reals, up 8.86% since Wednesday.
January 22 The Central Bank of Brazil intervened to defend the real for the first time since Friday the 15th, after its steady devaluation stirred up concerns for the future of Brazil. The dollar closed at 1.72 reals.
February 11 US agency Moody’s decided to maintain its risk rating for the Mexican debt after several months discussing a potential lowering of said score.
February 21 The Group of Seven more industrialized economies backed the proposal to create a global forum to allow for the regular exchange of information among the principal financial regulators.
February 25 The Russian 1999 budget act became effective today. This law is a fundamental part of the government’s plan to cope with the financial crisis and regain the confidence of foreign investors and the International Monetary Fund. The IMF has refused to resume financial aid for Russia, overburdened by a US$145 billion foreign debt, until it receives accurate information on how the Russian government plans to use said funds.
Summary Tables and Figures
|
Real GDP Growth in the APEC Region (Percent change per annum except as indicated) |
|||||||||
|
1992 |
1993 |
1994 |
1995 |
1996 |
1997 |
1998 |
1999 |
2000 |
|
|
Western Hemisphere |
2.6 |
2.4 |
3.7 |
2.1 |
3.4 |
4.1 |
3.8 |
3.2 |
2.3 |
|
Canada |
0.9 |
2.3 |
4.7 |
2.8 |
1.7 |
4.0 |
3.1 |
2.6 |
2.5 |
|
Chile |
12.3 |
7.0 |
5.7 |
10.6 |
7.4 |
7.1 |
3.4 |
2.0 |
4.6 |
|
Mexico |
3.6 |
2.0 |
4.4 |
-6.2 |
5.2 |
7.0 |
4.8 |
2.0 |
3.0 |
|
Peru |
-1.7 |
6.4 |
13.1 |
7.3 |
2.4 |
6.9 |
0.3 |
4.5 |
6.5 |
|
United States |
2.7 |
2.3 |
3.5 |
2.3 |
3.5 |
3.9 |
3.9 |
3.3 |
2.2 |
|
Northeast Asia |
2.9 |
2.4 |
2.5 |
3.2 |
5.8 |
3.1 |
-0.8 |
0.5 |
2.2 |
|
China |
14.2 |
13.5 |
12.6 |
10.5 |
9.6 |
8.8 |
7.8 |
6.6 |
7.0 |
|
Hong Kong, China |
6.3 |
6.1 |
5.4 |
3.9 |
4.5 |
5.3 |
-5.1 |
-1.3 |
3.1 |
|
Japan |
1.0 |
0.3 |
0.6 |
1.5 |
5.1 |
1.4 |
-2.8 |
-1.4 |
0.3 |
|
Korea |
5.1 |
5.8 |
8.6 |
8.9 |
7.1 |
5.0 |
-5.5 |
2.0 |
4.6 |
|
Chinese Taipei |
6.8 |
6.3 |
6.5 |
6.0 |
5.7 |
6.8 |
4.8 |
3.9 |
4.8 |
|
Southeast Asia |
6.4 |
7.4 |
8.1 |
8.1 |
7.0 |
4.5 |
-5.5 |
0.6 |
3.2 |
|
Brunei Darussalam |
-1.1 |
0.5 |
1.8 |
2.0 |
3.5 |
4.0 |
1.0 |
0.6 |
1.5 |
|
Indonesia |
7.2 |
7.3 |
7.5 |
8.2 |
7.8 |
4.9 |
-13.7 |
-1.1 |
3.3 |
|
Malaysia |
7.8 |
8.3 |
9.2 |
9.5 |
8.6 |
7.7 |
-6.7 |
0.9 |
2.0 |
|
Philippines |
0.3 |
2.1 |
4.4 |
4.7 |
5.8 |
5.2 |
-0.5 |
2.0 |
3.0 |
|
Singapore |
6.2 |
10.4 |
10.5 |
8.7 |
6.9 |
7.8 |
1.3 |
0.5 |
4.2 |
|
Thailand |
8.1 |
8.3 |
8.8 |
8.6 |
5.5 |
-0.4 |
-8.0 |
1.0 |
3.0 |
|
Viet Nam |
0.0 |
8.1 |
8.8 |
9.5 |
9.3 |
8.2 |
5.8 |
3.5 |
4.5 |
|
Oceania |
2.5 |
4.2 |
5.3 |
4.2 |
3.5 |
3.3 |
4.3 |
3.1 |
3.2 |
|
Australia |
2.5 |
3.8 |
5.2 |
4.3 |
3.6 |
3.6 |
5.0 |
3.1 |
3.2 |
|
New Zealand |
0.9 |
5.1 |
6.0 |
4.0 |
3.2 |
2.0 |
-0.3 |
2.7 |
3.3 |
|
Papau New Guinea |
13.8 |
16.6 |
5.2 |
-3.6 |
3.5 |
-4.6 |
2.5 |
n.a. |
n.a. |
|
Russia |
-14.5 |
-8.7 |
-12.7 |
-4.0 |
-3.4 |
0.9 |
-4.6 |
-7.0 |
0.0 |
|
APEC |
2.7 |
2.4 |
3.1 |
2.7 |
4.3 |
3.7 |
1.9 |
2.1 |
2.3 |
Source: Member economies, except forecast (IMF)
|
Increases in CPI in APEC Member Economies (Percent change per annum) |
|||||||
|
1992 |
1993 |
1994 |
1995 |
1996 |
1997 |
1998 |
|
|
Western Hemisphere |
3.9 |
3.5 |
2.8 |
4.6 |
3.9 |
2.9 |
2.3 |
|
Canada |
1.5 |
1.8 |
0.2 |
2.2 |
1.6 |
1.6 |
0.9 |
|
Chile |
12.7 |
12.2 |
8.9 |
8.2 |
6.6 |
6.0 |
4.7 |
|
Mexico |
15.5 |
9.8 |
7.0 |
52.0 |
27.7 |
15.7 |
18.6 |
|
Peru |
56.7 |
39.5 |
15.4 |
10.2 |
11.8 |
6.5 |
6.0 |
|
United States |
3.0 |
3.0 |
2.6 |
2.8 |
2.9 |
2.3 |
1.6 |
|
Northeast Asia |
2.7 |
3.2 |
3.5 |
2.3 |
1.8 |
2.2 |
0.9 |
|
China |
6.4 |
14.7 |
24.1 |
17.1 |
8.3 |
2.8 |
-0.8 |
|
Hong Kong, China |
9.6 |
8.8 |
8.8 |
9.1 |
6.3 |
5.8 |
2.8 |
|
Japan |
1.6 |
1.3 |
0.7 |
-0.1 |
0.1 |
1.8 |
0.6 |
|
Korea |
6.2 |
4.8 |
6.2 |
4.5 |
4.9 |
4.5 |
7.5 |
|
Chinese Taipei |
4.5 |
2.9 |
4.1 |
3.7 |
3.1 |
0.9 |
1.7 |
|
Southeast Asia |
4.8 |
5.9 |
6.6 |
6.3 |
5.5 |
6.3 |
21.5 |
|
Brunei Darussalam |
1.3 |
4.3 |
2.4 |
6.0 |
2.0 |
1.7 |
-0.4 |
|
Indonesia |
4.9 |
9.8 |
9.2 |
8.6 |
6.5 |
10.3 |
77.6 |
|
Malaysia |
4.7 |
3.6 |
3.7 |
3.4 |
3.5 |
2.7 |
5.3 |
|
Philippines |
8.6 |
7.0 |
8.3 |
8.0 |
9.1 |
5.9 |
9.7 |
|
Singapore |
2.3 |
2.3 |
3.1 |
1.7 |
1.4 |
2.0 |
-0.3 |
|
Thailand |
4.1 |
3.3 |
5.0 |
5.8 |
5.9 |
5.6 |
8.1 |
|
Viet Nam |
0.0 |
5.2 |
14.4 |
12.7 |
4.5 |
3.6 |
9.2 |
|
Oceania |
1.1 |
1.8 |
2.0 |
4.5 |
2.7 |
0.4 |
0.9 |
|
Australia |
1.0 |
1.8 |
1.9 |
4.6 |
2.6 |
0.3 |
0.9 |
|
New Zealand |
1.3 |
1.4 |
2.8 |
2.9 |
2.6 |
0.8 |
0.4 |
|
Papau New Guinea |
4.3 |
4.9 |
2.9 |
17.3 |
11.6 |
3.9 |
10.0 |
|
Russia |
2609.0 |
939.9 |
315.1 |
231.3 |
121.8 |
111.0 |
184.4 |
|
APEC |
20.6 |
15.5 |
8.7 |
8.4 |
6.1 |
5.5 |
5.4 |
|
Unemployment Rates in the APEC Region (Percent change per annum) |
|||||||
|
1992 |
1993 |
1994 |
1995 |
1996 |
1997 |
1998 |
|
|
Western Hemisphere |
6.9 |
6.6 |
6.1 |
6.2 |
5.8 |
5.1 |
4.6 |
|
Canada |
11.3 |
11.2 |
10.4 |
9.5 |
9.7 |
9.2 |
8.3 |
|
Chile |
6.7 |
6.6 |
7.8 |
7.4 |
6.5 |
6.1 |
6.2 |
|
Mexico |
2.8 |
3.4 |
3.6 |
6.3 |
5.5 |
3.2 |
2.8 |
|
Peru |
9.7 |
10.3 |
9.0 |
7.6 |
7.0 |
7.7 |
7.7 |
|
United States |
7.5 |
6.9 |
6.1 |
5.6 |
5.4 |
4.9 |
4.5 |
|
Northeast Asia |
2.3 |
2.6 |
2.8 |
2.9 |
3.0 |
3.1 |
3.3 |
|
China |
2.3 |
2.6 |
2.8 |
2.9 |
3.0 |
3.1 |
3.1 |
|
Hong Kong, China |
2.0 |
2.0 |
1.9 |
3.2 |
2.8 |
2.2 |
4.7 |
|
Japan |
2.2 |
2.5 |
2.9 |
3.2 |
3.4 |
3.4 |
4.1 |
|
Korea |
2.4 |
2.8 |
2.4 |
2.0 |
2.0 |
2.6 |
6.8 |
|
Chinese Taipei |
1.5 |
1.5 |
1.6 |
1.8 |
2.6 |
2.7 |
2.7 |
|
Southeast Asia |
3.5 |
3.5 |
4.1 |
5.4 |
5.2 |
5.6 |
6.0 |
|
Brunei Darussalam |
4.5 |
4.1 |
3.6 |
4.9 |
5.0 |
5.0 |
5.1 |
|
Indonesia |
2.7 |
3.1 |
4.4 |
7.2 |
4.9 |
4.3 |
5.1 |
|
Malaysia |
3.7 |
3.0 |
2.9 |
2.8 |
2.5 |
2.7 |
3.9 |
|
Philippines |
9.8 |
9.3 |
9.5 |
9.5 |
8.6 |
8.7 |
10.1 |
|
Singapore |
2.0 |
1.9 |
2.0 |
2.0 |
2.0 |
1.8 |
3.2 |
|
Thailand |
3.0 |
2.6 |
2.6 |
2.6 |
2.0 |
3.5 |
4.0 |
|
Viet Nam |
n.a. |
n.a. |
n.a. |
n.a. |
6.0 |
8.5 |
6.6 |
|
Oceania |
9.1 |
9.0 |
7.9 |
6.8 |
6.8 |
6.9 |
6.7 |
|
Australia |
10.8 |
10.9 |
9.7 |
8.5 |
8.5 |
8.5 |
8.0 |
|
New Zealand |
10.3 |
9.1 |
7.4 |
6.2 |
6.0 |
6.7 |
7.7 |
|
Papau New Guinea |
n.a. |
n.a. |
n.a. |
n.a. |
n.a. |
n.a. |
n.a. |
|
Russia |
n.a. |
n.a. |
7.8 |
9.1 |
9.9 |
11.2 |
12.3 |
|
APEC |
3.2 |
3.3 |
3.9 |
4.3 |
4.3 |
4.4 |
4.6 |
|
Current Account Balances as a Share of GDP (Percent change per annum) |
|||||||
|
1992 |
1993 |
1994 |
1995 |
1996 |
1997 |
1998 |
|
|
Western Hemisphere |
|
|
|
|
|
|
|
|
Canada |
-3.6 |
-3.9 |
-2.4 |
-0.8 |
0.6 |
-1.8 |
-2.0 |
|
Chile |
-2.3 |
-5.7 |
-3.1 |
-2.1 |
-5.4 |
-5.3 |
-6.2 |
|
Mexico |
-6.7 |
-5.8 |
-7.0 |
-0.6 |
-0.6 |
-1.8 |
-3.8 |
|
Peru |
-5.0 |
-5.6 |
-5.3 |
-7.3 |
-5.9 |
-5.0 |
-6.0 |
|
United States |
-0.9 |
-1.3 |
-1.8 |
-1.6 |
-1.7 |
-1.8 |
-2.6 |
|
Northeast Asia |
|
|
|
|
|
|
|
|
China |
1.3 |
-2.0 |
1.4 |
0.2 |
0.9 |
3.3 |
3.0 |
|
Hong Kong, China |
5.3 |
7.0 |
1.2 |
-4.3 |
-1.4 |
-3.5 |
0.4 |
|
Japan |
3.0 |
3.1 |
2.8 |
2.1 |
1.4 |
2.3 |
3.2 |
|
Korea |
-1.5 |
0.1 |
-1.2 |
-2.0 |
-4.9 |
-1.9 |
13.1 |
|
Chinese Taipei |
4.0 |
3.2 |
2.7 |
2.1 |
4.0 |
2.7 |
1.4 |
|
Southeast Asia |
|
|
|
|
|
|
|
|
Brunei Darussalam |
66.4 |
62.9 |
68.6 |
57.6 |
50.0 |
48.9 |
44.6 |
|
Indonesia |
-2.2 |
-1.5 |
-1.7 |
-3.4 |
-3.5 |
-2.3 |
3.8 |
|
Malaysia |
-3.8 |
-4.8 |
-6.4 |
-8.0 |
-5.1 |
-5.4 |
13.7 |
|
Philippines |
-1.6 |
-5.5 |
-4.6 |
-4.4 |
-4.8 |
-5.3 |
2.0 |
|
Singapore |
12.0 |
7.3 |
16.2 |
16.9 |
15.9 |
15.4 |
n.a. |
|
Thailand |
-5.7 |
-5.1 |
-5.6 |
-8.1 |
-7.9 |
-2.0 |
12.3 |
|
Viet Nam |
0.0 |
-7.1 |
-8.0 |
-11.0 |
-10.3 |
-6.8 |
-4.1 |
|
Oceania |
|
|
|
|
|
|
|
|
Australia |
-3.7 |
-3.3 |
-5.1 |
-5.4 |
-3.9 |
-3.2 |
-4.8 |
|
New Zealand |
-2.7 |
-1.2 |
-2.2 |
-3.1 |
-4.1 |
-7.1 |
-6.0 |
|
Papau New Guinea |
2.2 |
12.8 |
10.8 |
13.6 |
5.9 |
-2.4 |
-1.1 |
|
Russia |
n.a. |
6.9 |
4.2 |
2.3 |
2.8 |
0.7 |
1.8 |
|
Short-term Interest Rate (%) (Percent change per annum) |
|||||||
|
1992 |
1993 |
1994 |
1995 |
1996 |
1997 |
1998 |
|
|
Western Hemisphere |
|
|
|
|
|
|
|
|
Canada |
6.7 |
5.0 |
5.7 |
7.2 |
4.4 |
3.6 |
5.1 |
|
Chile |
5.5 |
6.5 |
6.4 |
6.1 |
7.3 |
6.8 |
9.7 |
|
Mexico |
16.8 |
11.8 |
20.1 |
48.7 |
27.3 |
19.8 |
n.a. |
|
Peru |
117.8 |
74.1 |
31.3 |
28.2 |
26.5 |
26.3 |
37.1 |
|
United States |
3.5 |
3.1 |
4.4 |
5.7 |
5.2 |
5.2 |
4.9 |
|
Northeast Asia |
|
|
|
|
|
|
|
|
China |
8.1 |
8.8 |
9.0 |
9.0 |
9.7 |
7.7 |
6.3 |
|
Hong Kong, China |
3.9 |
3.4 |
4.8 |
6.2 |
5.5 |
7.1 |
8.1 |
|
Japan |
4.4 |
2.9 |
2.2 |
1.2 |
0.6 |
0.6 |
0.7 |
|
Korea |
16.4 |
13.0 |
12.3 |
12.4 |
12.4 |
13.3 |
15.1 |
|
Chinese Taipei |
7.2 |
6.8 |
6.8 |
6.7 |
5.8 |
6.8 |
6.8 |
|
Southeast Asia |
|
|
|
|
|
|
|
|
Brunei Darussalam |
6.0 |
5.8 |
6.0 |
6.5 |
6.5 |
7.0 |
5.3 |
|
Indonesia |
12.0 |
8.7 |
9.9 |
13.6 |
14.1 |
30.5 |
64.1 |
|
Malaysia |
8.0 |
6.5 |
5.5 |
6.8 |
7.4 |
8.7 |
6.5 |
|
Philippines |
16.1 |
12.3 |
13.6 |
11.3 |
12.4 |
13.1 |
15.3 |
|
Singapore |
2.5 |
2.3 |
3.6 |
3.4 |
3.4 |
4.1 |
n.a. |
|
Thailand |
7.0 |
5.5 |
6.3 |
10.5 |
12.0 |
24.0 |
3.1 |
|
Viet Nam |
n.a. |
n.a. |
n.a. |
n.a. |
n.a. |
n.a. |
n.a. |
|
Oceania |
|
|
|
|
|
|
|
|
Australia |
6.5 |
5.2 |
5.7 |
7.7 |
7.2 |
5.4 |
5.0 |
|
New Zealand |
6.7 |
6.3 |
6.7 |
9.0 |
9.3 |
7.7 |
7.3 |
|
Papau New Guinea |
8.9 |
6.3 |
6.9 |
17.4 |
14.4 |
9.9 |
21.1 |
|
Russia |
n.a. |
n.a. |
n.a. |
168.0 |
85.8 |
31.5 |
39.9 |
|
Exchange Rate (Local Currency/US$) |
|||||||
|
1992 |
1993 |
1994 |
1995 |
1996 |
1997 |
1998 |
|
|
Western Hemisphere |
|
|
|
|
|
|
|
|
Canada |
1.2 |
1.3 |
1.4 |
1.4 |
1.4 |
1.4 |
1.5 |
|
Chile |
362.6 |
404.2 |
420.2 |
396.8 |
412.3 |
419.3 |
460.3 |
|
Mexico |
3.1 |
3.1 |
3.4 |
6.2 |
7.6 |
7.9 |
9.9 |
|
Peru |
1.3 |
2.0 |
2.2 |
2.3 |
2.5 |
2.7 |
2.9 |
|
United States |
126.7 |
111.2 |
102.2 |
94.1 |
108.8 |
121.0 |
130.9 |
|
Northeast Asia |
|
|
|
|
|
|
|
|
China |
5.5 |
5.8 |
8.6 |
8.4 |
8.3 |
8.3 |
8.3 |
|
Hong Kong, China |
7.7 |
7.7 |
7.7 |
7.7 |
7.7 |
7.7 |
7.7 |
|
Japan |
126.7 |
111.2 |
102.2 |
94.1 |
108.8 |
121.0 |
130.9 |
|
Korea |
788.4 |
808.1 |
788.7 |
774.7 |
844.2 |
1415.2 |
1207.8 |
|
Chinese Taipei |
26.2 |
26.4 |
26.5 |
26.5 |
27.5 |
28.7 |
33.5 |
|
Southeast Asia |
|
|
|
|
|
|
|
|
Brunei Darussalam |
1.6 |
1.6 |
1.5 |
1.4 |
1.4 |
1.7 |
1.6 |
|
Indonesia |
2030.0 |
2087.0 |
2200.0 |
2308.0 |
2383.0 |
4650.0 |
8025.0 |
|
Malaysia |
2.6 |
2.7 |
2.6 |
2.5 |
2.5 |
3.9 |
3.8 |
|
Philippines |
25.5 |
27.1 |
26.4 |
25.7 |
26.2 |
29.5 |
40.9 |
|
Singapore |
1.6 |
1.6 |
1.5 |
1.4 |
1.4 |
1.5 |
n.a. |
|
Thailand |
25.4 |
25.3 |
25.2 |
25.0 |
25.3 |
31.4 |
41.4 |
|
Viet Nam |
n.a. |
106040.0 |
10955.0 |
10970.0 |
11100.0 |
11600.0 |
13297.0 |
|
Oceania |
|
|
|
|
|
|
|
|
Australia |
6.0 |
8.2 |
-7.1 |
-1.3 |
5.3 |
5.2 |
18.2 |
|
New Zealand |
1.9 |
1.8 |
1.7 |
1.5 |
1.5 |
1.5 |
1.9 |
|
Papau New Guinea |
1.0 |
1.0 |
1.0 |
0.8 |
0.8 |
0.7 |
0.5 |
|
Russia |
0.2 |
0.9 |
2.2 |
4.6 |
5.1 |
5.8 |
9.7 |